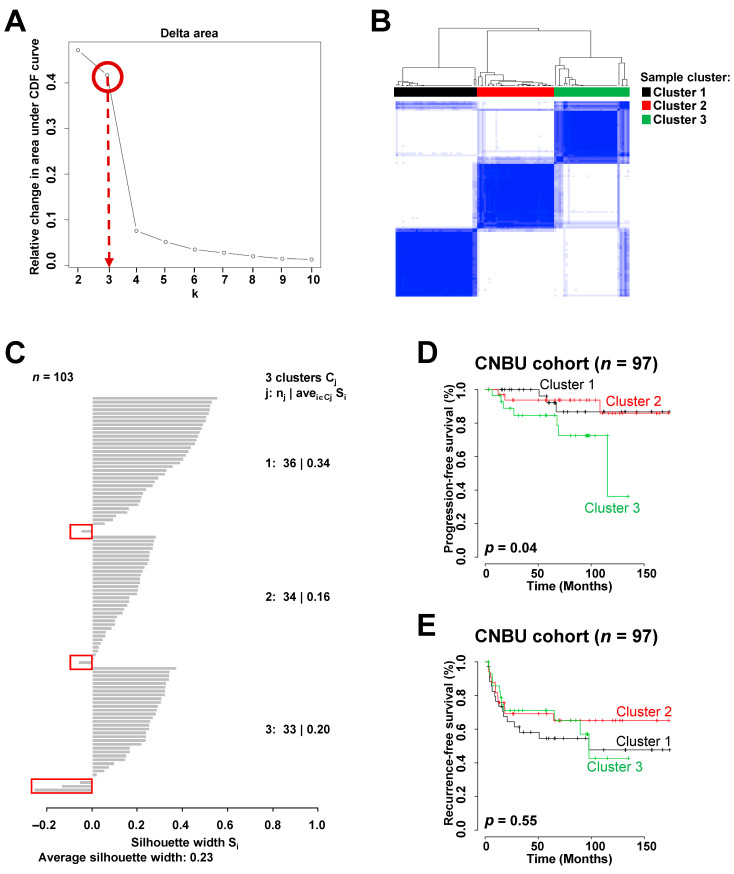
Figure 1.
Identification of molecular subgroups and their association with prognosis in the Chungbuk National University (CBNU) cohort with non-muscle-invasive bladder cancer (NMIBC) (n = 103). A total of 1623 genes showing variation in expression across samples were selected for cluster analysis (standard deviation (SD) > 0.9). (A) Cluster stability estimated according to relative changes in the area under the consensus distribution function curve across k = 2–10, revealed that three clusters were clearly distinguishable in the NMIBC samples (the max slope of the curve occurs between three and four clusters). (B) Consensus matrix heatmap for k = 3. Data are presented in matrix format, in which white and blue denote no correlation (0) or a perfect correlation (1), respectively. (C) Silhouette widths of the CBNU cohort of 103 NMIBC samples. The figure shows the silhouette widths of samples in each cluster. Samples with positive Silhouette widths were selected to estimate the prognostic values of each sample cluster, whereas five samples with negative silhouette values in the red boxes were discarded. (D,E) Kaplan–Meier curves showing time to progression or recurrence in NMIBC patients in the CBNU cohort. p-values were calculated using log-rank tests.

