Figure 2.
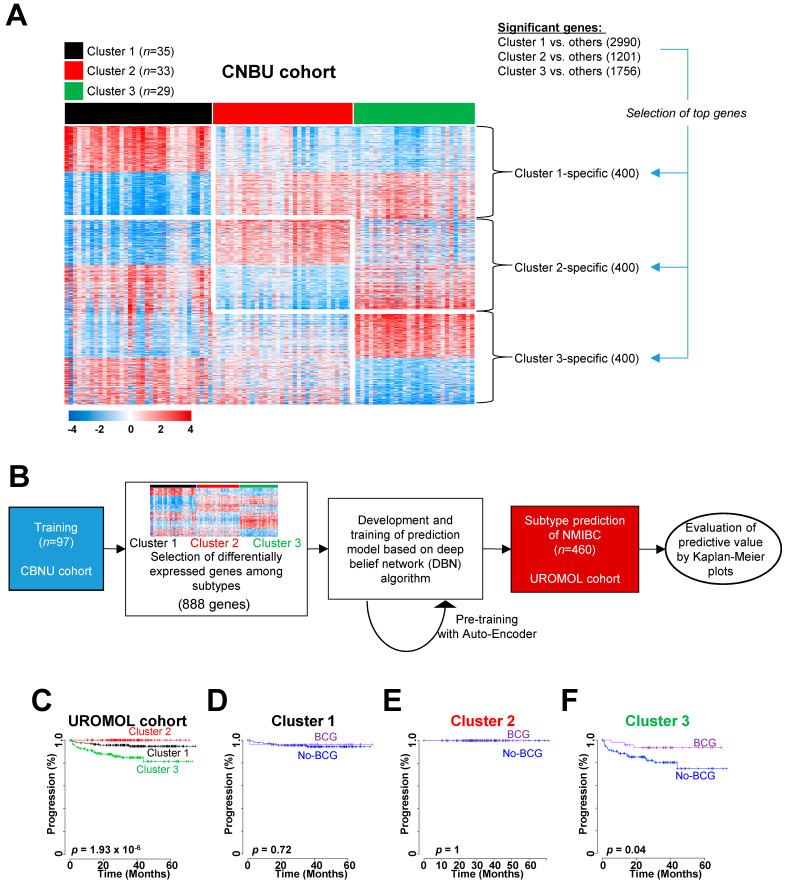
Construction of the subtype classifier and validation of its prognostic value in the UROMOL cohort. (A) Expression pattern of cluster-specific genes. Data are presented in matrix format, in which rows represent individual genes and columns represent each tissue. Red and blue reflect high and low expression levels, respectively. (B) Validation strategy used to construct a prediction model, and evaluation of predicted outcomes based on 888 genes. (C) Kaplan–Meier plots of progression of non-muscle-invasive bladder cancer (NMIBC) patients from the UROMOL cohort, as predicted by a deep belief network algorithm. (D–F) Ability of the 888 gene-based classifier to predict a response to BCG treatment in the three subgroups. Patients in Cluster 3 (F) derived significant benefit from BCG treatment. Data were plotted according to whether patients received BCG therapy. CBNU, Chungbuk National University Hospital; BCG, Bacillus Calmette-Guérin.

