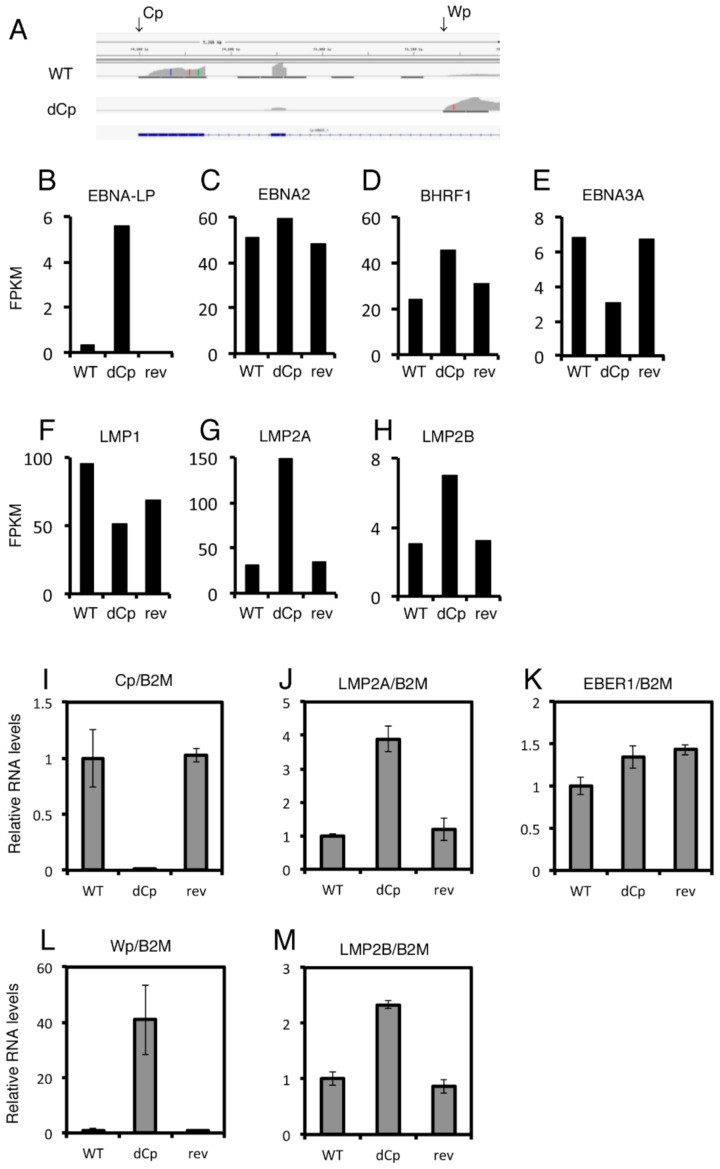
Figure 5.
RNA sequencing (RNA-seq) and qRT–PCR of WT, dCp and rev virus-infected lymphoblastoid cell lines (LCLs). (A–H) RNA-seq analysis of infected LCLs. (A) read mapping of transcripts aligned to the Cp/Wp region of EBV. (B–H) fragments per kilobase of exon per million reads mapped (FPKM) data of EBV genes are depicted. (I–M) qRT–PCR of the LCLs. Relative RNA levels were standardized by β2-microglobulin (B2M). The mean and standard deviation values of three independent experiments are shown.

