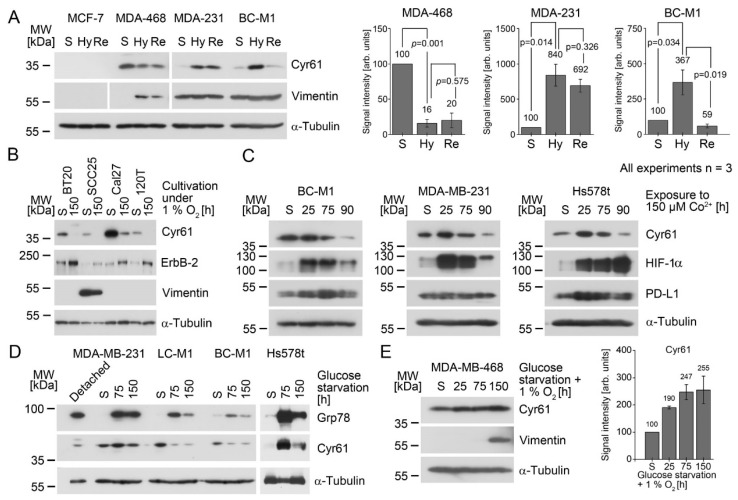
Figure 2.
Response of the Cyr61 levels to hostile microenvironmental conditions; analyses by Western blot analysis. The starting conditions for all of the experiments were the standard cell culture conditions (S). (A) Response of Cyr61 levels to chronic hypoxia (14 days 1% O2; condition Hy) and reoxygenation (Re: Hy followed by 10% O2 for 4 h). The statistical analyses of the changes in the protein levels are shown in the bar diagrams (right), and the obtained p-values are presented as numbers. The p-values were calculated using Student’s t-test (nbiol = 3). The corresponding scatterplot is shown in Figure S2. (B) Downregulation of Cyr61 under hypoxia (1% O2) and the induction of ErbB-2 under hypoxia. (C) Effect of the stabilization of HIF-1α to Cyr61 and PD-L1 levels after the treatment of the cells with cobalt chloride. (D) Effect of glucose starvation on the Cyr61 levels. As a large amount of MDA-MB-231 cells detached from the cell culture flask after 50 h of glucose withdrawal, the detached cells were analysed separately. The 78 kDa glucose-regulated protein (Grp78) was analysed as a positive control for a cellular response after glucose withdrawal. (E) Induction of Cyr61 under hypoxia and glucose starvation. The diagrams display the quantitative analyses of the Cyr61 levels of the Western blot images (nbiol = 3). The numbers above the error bars (standard deviation) represent the average values. The corresponding scatterplot is shown in Figure S3.

