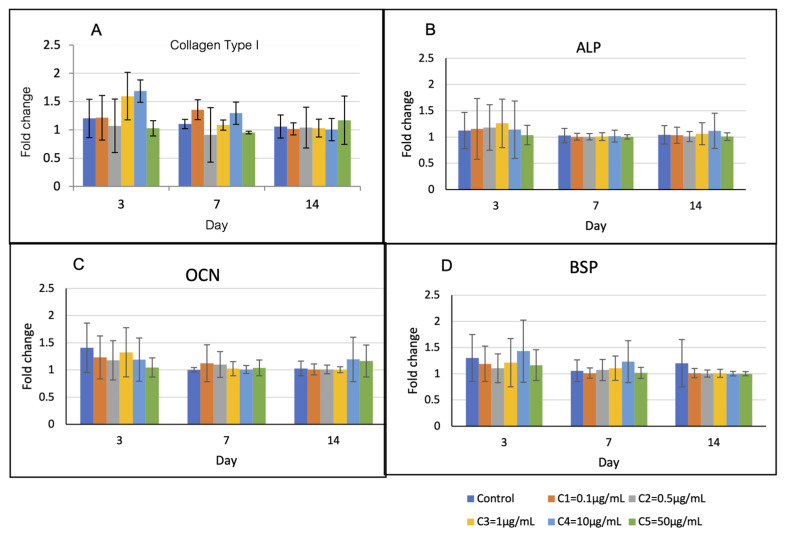
Figure 6.
Osteoblast-related gene expression over 14 days. (A) On day 3, the levels of Col-1 of groups C3 and C4 were higher than those of the other groups (p > 0.05). (B) and (C) The levels of ALP and OCN of all groups were not statistically different over the observation period. (D) On day 3 and 7, the levels of BSP of group C4 were higher than those of the other groups (p > 0.05).

