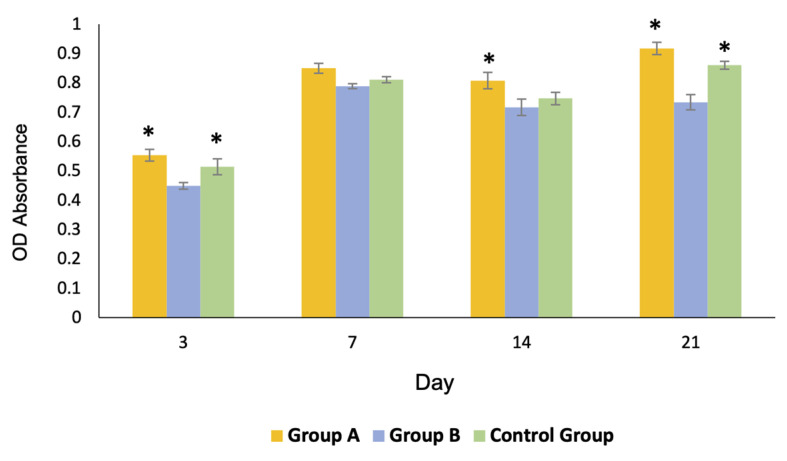
Figure 8.
Profiles of the cell proliferation of all groups over 21 days. The growth of the cells of group A and the control group C was significantly greater than that of group B on day 3 and 21 (* = p < 0.05). The growth of group A was significantly greater than that of the other groups on day 14 (* = p < 0.05).

