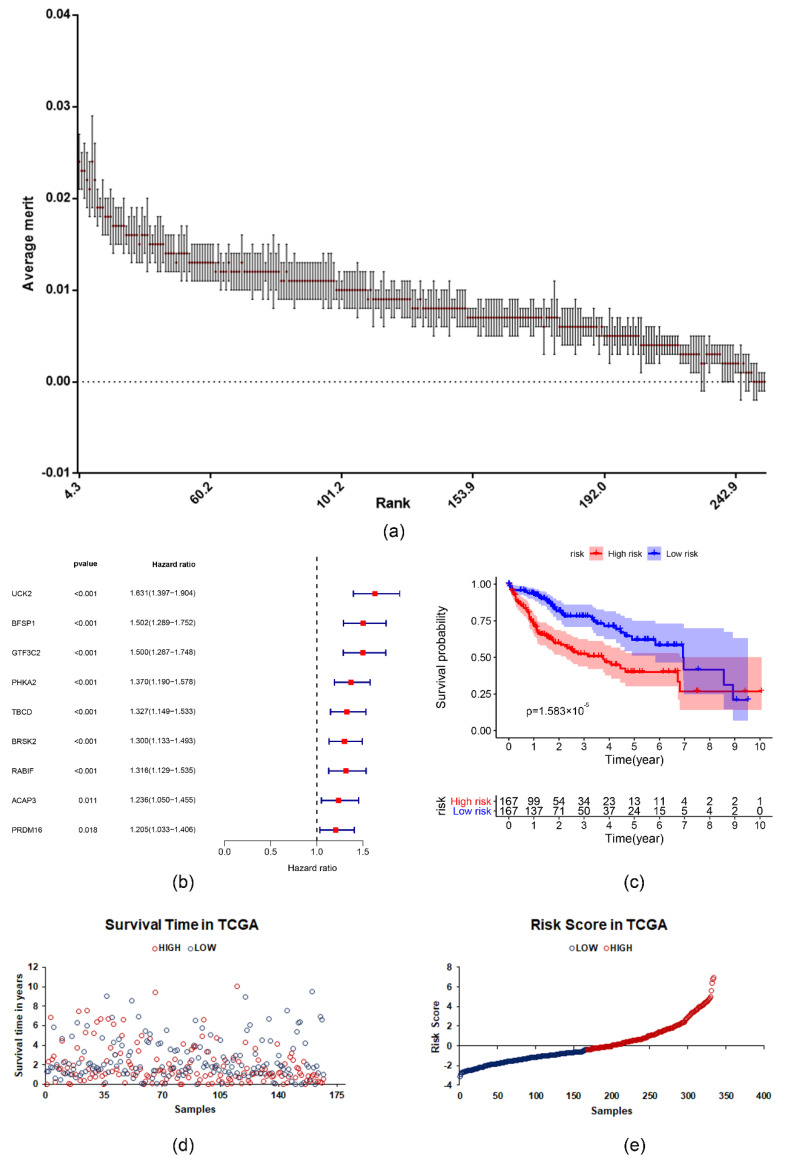
Figure 3.
Features selection and Cox regression analysis were used to construct and analyze risk scores based on the survival-related m6A RNA methylation-related genes. (a) Rank of the survival-related m6A RNA methylation-related genes based on Relief algorithm. (b) The impact of important survival-related m6A RNA methylation-related genes on overall survival. (c) The Kaplan–Meier curve described the significant survival difference between the high-risk group and the low-risk group. (d) The distribution of survival time of samples in TCGA dataset. (e) The distribution of risk score of samples in TCGA dataset.

