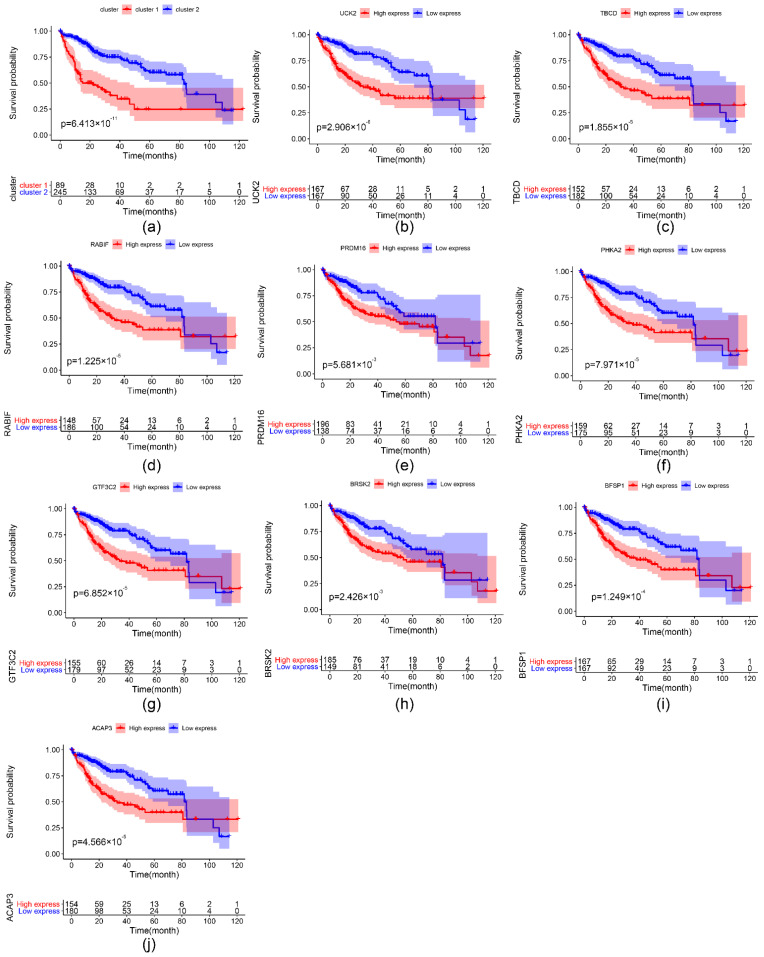
Figure 8.
Kaplan–Meier analysis of clusters according to the ConsensusClusterPlus and the important survival-related m6A RNA methylation-related genes. (a) Kaplan–Meier curves of TCGA samples which were divided into 2 clusters according to the ConsensusClusterPlus. (b–j) Kaplan–Meier curves of the important survival-related m6A RNA methylation-related genes. The unit of survival time is months.

