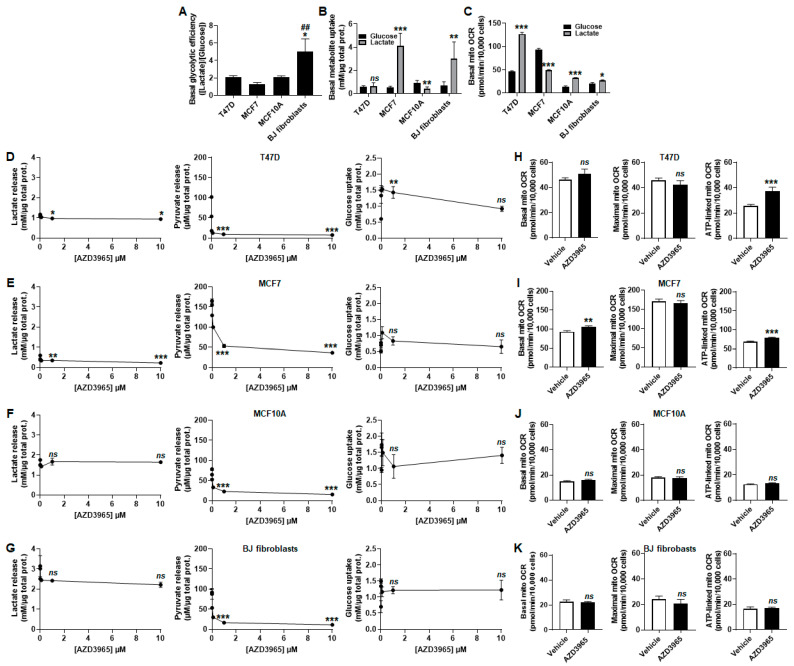
Figure 4.
When MCT1 is used by proliferating cells to export lactate, AZD3965 induces an oxidative switch supporting ATP production in malignant but not in nonmalignant breast-associated cells. (A) Glycolytic efficiency of the cells cultured in medium containing 25 mmol/L glucose with 10 mmol/L GlutaMAX and 10% FBS, without added lactate, calculated as the lactate production/glucose consumption ratio (n = 3–5). (B) Glucose and lactate uptake over 24 h by untreated T47D, MCF7, MCF10A cells and BJ fibroblasts cultured in medium containing 25 mmol/L glucose with 10 mmol/L GlutaMAX and 10% FBS, without added lactate (to determine basal glucose uptake, black bars) or in medium containing 10 mmol/L sodium L-lactate with no glucose, no glutamine and with 1% FBS (to determine basal lactate uptake, grey bars) (n = 3–5). (C) Basal mito OCR of the cells cultured in medium containing 25 mmol/L glucose with 10 mmol/L GlutaMAX, 10% FBS and without added lactate (to determine glucose-dependent OCR, black bars) or in medium containing 10 mmol/L sodium L-lactate with no glucose, no glutamine and with 1% FBS (to determine lactate-dependent OCR, grey bars) (n = 11–22). (D–K) Cells were metabolically characterized in medium containing 25 mmol/L glucose with 10 mmol/L GlutaMAX, 10% FBS and without added lactate. (D) Lactate release (right panel), pyruvate release (middle panel) and glucose uptake (right panel) over 24 h by T47D cells treated with increasing doses of AZD3965 (n = 3–6). (E) As in D, but using MCF7 cells (n = 3–6). (F) As in D, but using MCF10A cells (n = 3–6). (G) As in D, but using BJ fibroblasts (n = 3). (H) Basal mito OCR (left panel), maximal mito OCR (middle panel) and mito OCR linked to ATP production (right panel) of T47D cells treated for 24 h ± 10 µM AZD3965 (n = 9–12). (I) As in H, but using MCF7 cells (n = 11). (J) As in H, but using MCF10A cells (n = 11). (K) As in H, but using BJ fibroblasts (n = 11–12). All data are shown as means ± SEM. * p < 0.05, ** p < 0.01, *** p < 0.005, ns p > 0.05 compared to T47D cells (A), to cells in glucose-containing medium (B,C) or to vehicle (D–K); ## p < 0.01 compared to MCF7 cells; by one-way ANOVA followed by Dunnett’s post-hoc test (A,D–G) or Student’s t test (B,C,H–K).

