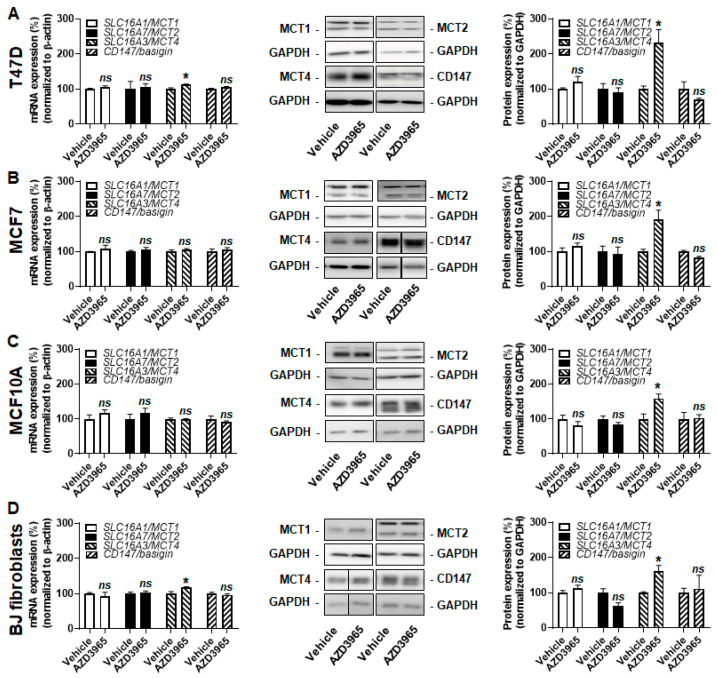
Figure 5.
Proliferative breast-associated cells upregulate MCT4 expression upon MCT1 inhibition by AZD3965. (A–D) Cells were assayed in medium containing 25 mmol/L glucose with 10 mmol/L GlutaMAX, 10% FBS and without added lactate. (A) mRNA (left panel) and protein (middle and right panels) expression of MCT1, MCT2, MCT4 and CD147/basigin in T47D cells treated for 24 h ± 10 µM AZD3965 (n = 3–6 for RT-qPCR, n = 3 for WB). (B) As in A, but using MCF7 cells (n = 3–6 for RT-qPCR, n = 6 for WB). (C) As in A, but using MCF10A cells (n = 3–6 for RT-qPCR, n = 3–9 for WB). (D) As in A, but using BJ fibroblasts (n = 3–6 for RT-qPCR, n = 3–6 for WB). All data are shown as means ± SEM. * p < 0.05, ns p > 0.05 compared to vehicle; by Student’s t test (A–D).

