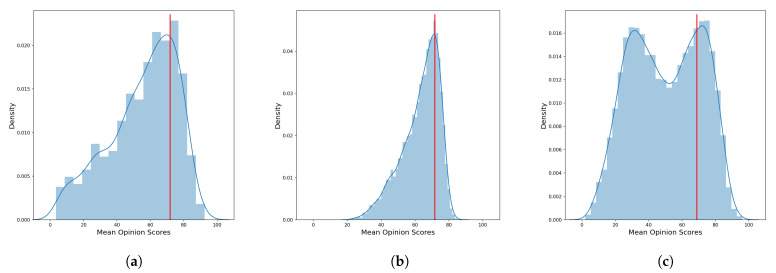
Figure 5.
Estimated density distribution of Mean Opinion Scores for the three datasets: (a) LIVE in the Wild Image Quality Challenge Database (LIVE-itW), (b) KonIQ-10k (KONIQ), and (c) Smartphone Photography Attribute and Quality database (SPAQ). The bars represents the normalized histogram, the blue line is the estimated density distribution while in red line is the 75th percentile respect the Mean Opinion Score (MOS).

