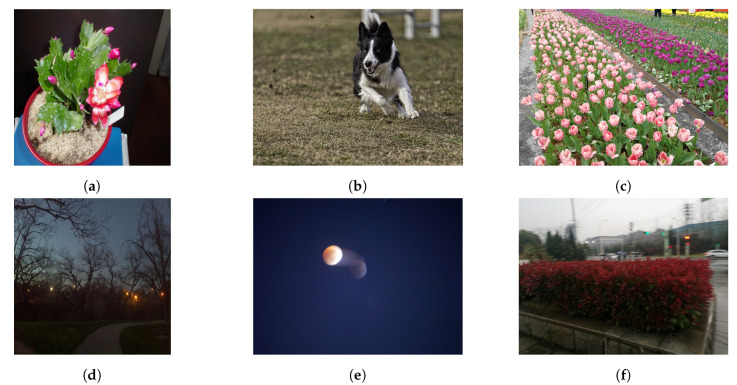
Figure 6.
Sample images form the three Image Quality Assessment (IQA) databases: (a) and (d) images from the LIVE-itW with a MOS of 78.81 and 43.67 respectively, (b) and (e) KONIQ’s pictures with a MOS of 71.46 and 43.36; finally (c) and (f) photos form SPAQ whit a MOS of 75.43 and 33.0 respectively.

