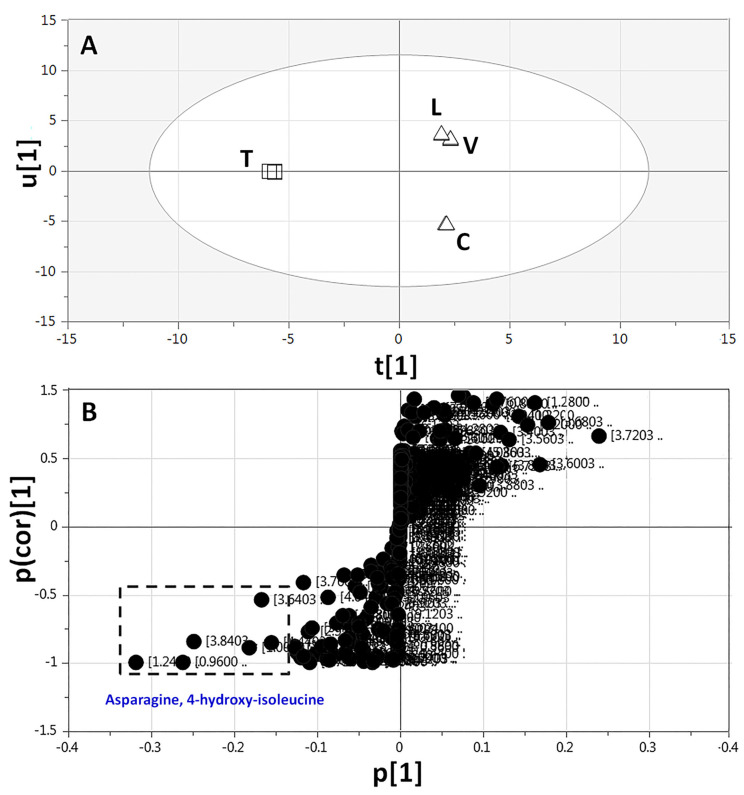
Figure 5.
Orthogonal projection to latent structures-discriminant analysis (OPLS-DA) based on full-range 1H-NMR (δ 11.0–0.0 ppm) of Trigonella sprouts (□) modelled against the remaining legume sprouts (∆) (n = 3). (A) OPLS-DA score plot and (B) loading plot derived from samples modelled against each other. The loading S-plot shows the covariance p[1] against the correlation p(cor)[1] of the variables of the discriminating component of the OPLS-DA model. Peak numbering follows those listed in Table 1 for metabolite identification using 1D- and 2D-NMR.

