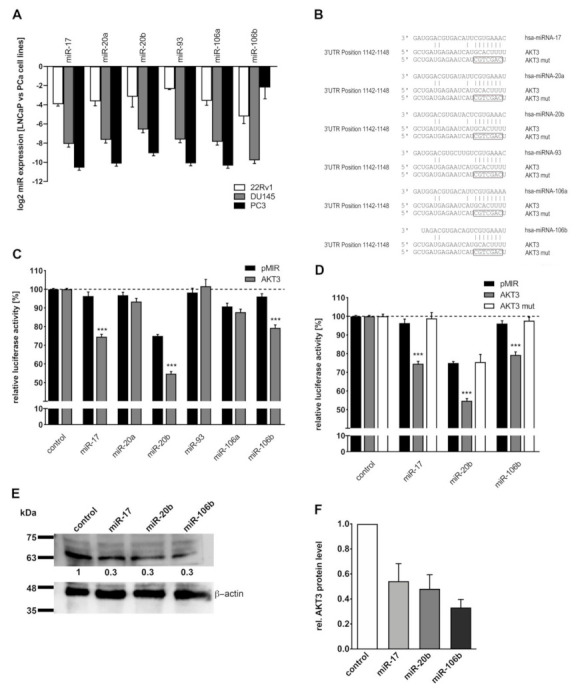
Figure 6.

Post-transcriptional regulation of AKT3 protein expression by miR-17 family. (A) Expression of miR-17 family members in PCa cell lines was analyzed by qRT-PCR. MiR-17 family expression in 22Rv1, DU145 and PC3 cells was normalized to LNCaP cells. All members of miR-17 family are decreased (0.1-fold) in 22Rv1 cells whereas DU145 and PC3 cells do not exhibit any miR-17 family expression, except miR-106b in PC3 cells. (B) Predicted miR-17 family binding site in the 3′UTR of AKT3 mRNA and the mutated miRNA binding sites are shown. (C) MiRNA expression plasmids were cotransfected with control reporter plasmid (pMIR, black bars) or reporter gene construct containing AKT3 3′UTR (AKT3, grey bars). The luciferase activity of the control reporter gene plasmid coexpressed with control expression construct was set to 100 %. The graph shows the mean ± SEM of four independent experiments. MiR-17, -20b and -106b significantly reduce (20–25 %) luciferase activity of the reporter gene construct containing AKT3 3′UTR in comparison to the control (each p = 0.0001; *** p < 0.001). (D) Control reporter plasmid (black bars), reporter construct with wildtype seed sequence (grey bars) and the reporter construct with mutated seed sequence (white bars) was coexpressed with control, miR-17, -20b or -106b expression plasmids. After mutation of the seed sequence, the corresponding miRNAs are not able to reduce the luciferase activity. The graph displays the mean ± SEM of six independent experiments. (E) A representative western blot analysis for AKT3 of LNCaP cells which were transfected with control or miRNA expression plasmids, showing decreased (0.3-fold) AKT3 protein level after enhanced miR-17, -20b or -106b expression. (F) Densitometrical determination of three independent western blot analysis for AKT3 protein level after transfection with miRNAs using β-actin as loading control. MiR-17, -20b and -106b expression reduce (0.3–0.5-fold) the endogenous AKT3 protein expression. Uncropped Western blot images are provided in Figure S4.
