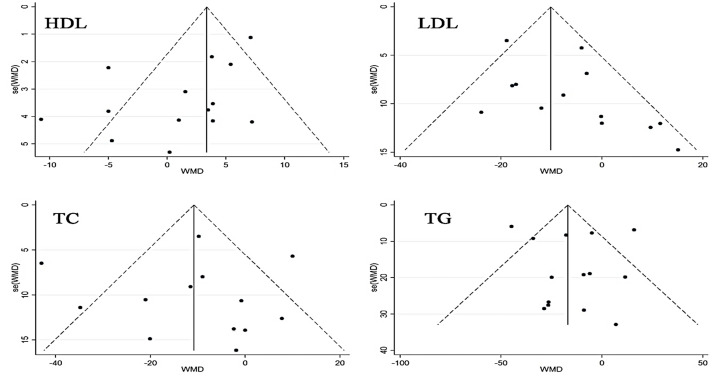
Figure 6.
Metafunnel plot of high-density lipoprotein, low-density lipoprotein, total cholesterol, and triglyceride serum level analyses based on Egger’s test *All plots represent pseudo 95% confidence intervals. WMD: Weighted mean difference; HLD: High-density lipoprotein; LDL: Low-density lipoprotein; TC: Total cholesterol; TG: Triglycerides

