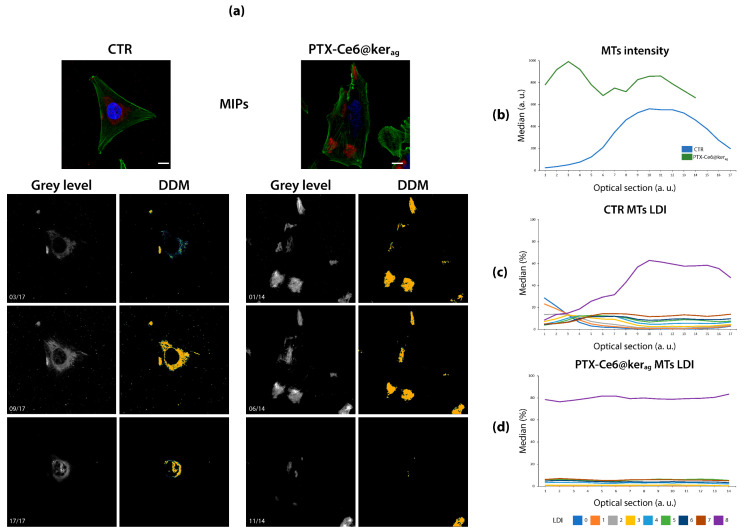
Figure 4.
DDMs disclose hidden distribution properties. (a) Top: RGB MIPs of MG-63 untreated (left) or exposed to PTX-Ce6@kerag nanoparticles (right) cells, stained for DNA (blue) and actin (green), and immunolabeled against and β-tubulin (red). Bottom: exemplificative optical sections (left) and DDMs (right) of β-tubulin signal distribution along Z-axis. Line plots of MTs median intensity (b) and percentage LDI distribution in CTR (c) and PTX-treated cells (d) along the Z-axis. In PTX presence, MTs are brighter (+126% on average, p < 10−5), denser (+69%, on average, p < 10−5) and more present at a high density through the sections (average CV through sections for LDI = 8:0.02). Scale bars: 10 µm.

