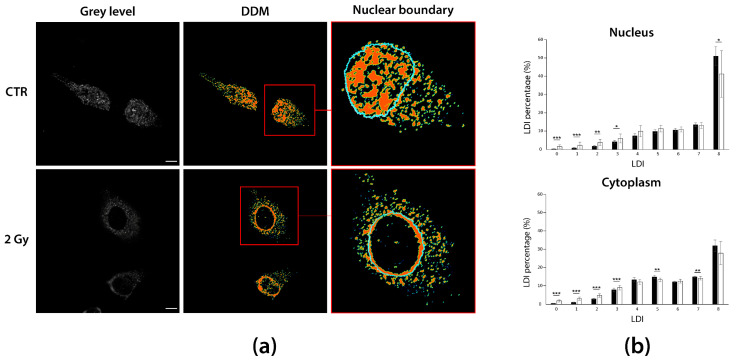
Figure 5.
DDMs can capture relevant spatial distributions blind to visual inspection. (a) Grey level images of untreated and 2-Gy irradiated A549 sh/p53 cells are used to compute DDMs for immunostained RNA:DNA hybrids. DDMs highlight a perinuclear hybrids crowding inside the nucleus of 2-Gy irradiated cells. (b) Bar graphs of LDI percentages in the main cell compartments. A549 sh/p53 2-Gy irradiation induces hybrids de-condensation in both nucleus and cytoplasm, although with a slightly different magnitude. * p < 0.05; ** p < 0.01; *** p < 0.001. Scale bars: 10 µm.

