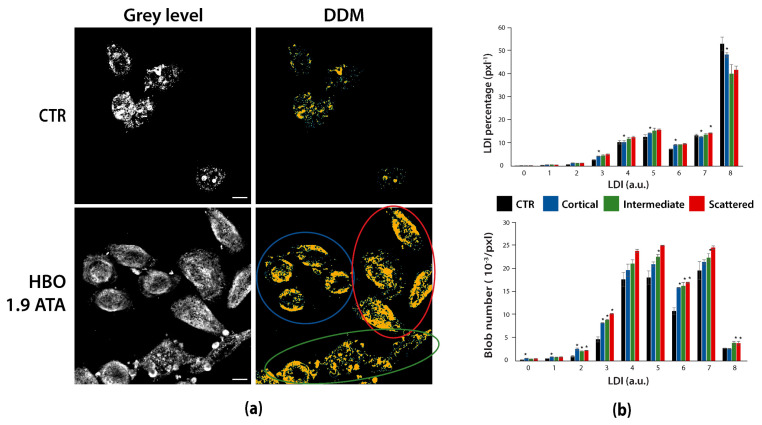
Figure 6.
DDMs can detect and quantify sample heterogeneity. (a) Grey level images and DDMs of untreated (CTR) and 1.9 ATA HBO-treated HeLa cells marked against RNA:DNA hybrids. DDMs separate three cell groups of cortical (blue), scattered (red) and intermediate (green) hybrids distributions among HBO-treated cells. (b) Bar graphs of LDI percentages and derived blob number in HeLa cells. * p < 0.05 for statistical comparison of the three groups with the untreated control. Scale bars: 10 µm.

