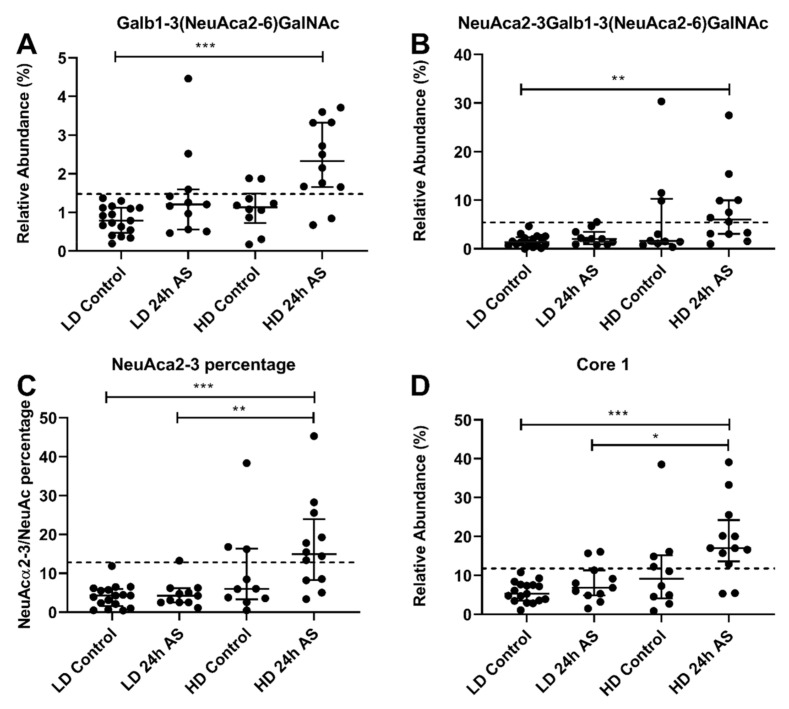
Figure 9.
O-glycans with potential as stress biomarkers. Atlantic salmon were grown under low density (LD) and high density (HD) conditions with and without acute stress (AS) protocol and glycans analyzed my LC-MS. (A,B) Relative abundance of m/z 675b and 966 in mucins from individual fish from the different cohorts. (C) Percentage of NeuAcα2-3 of total relative abundance of NeuAc containing structures. (D) Relative abundance of structures composed of core 1. Statistics: * p < 0.05, ** p < 0.01, *** p < 0.001; Kruskal–Wallis test with Dunn’s post hoc test. Data are presented as median and interquartile range. The dotted lines indicate the highest value of the LD control group.

