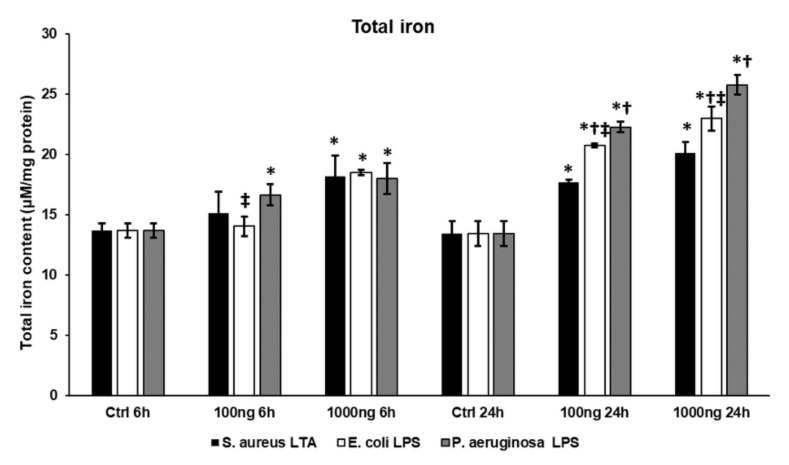
Figure 6.
Determinations of total iron content of THP-1 cells treated with S. aureus lipoteichoic acid (LTA), E. coli lipopolysaccharide (LPS) and P. aeruginosa LPS. Iron content of THP-1 cells was determined using a colorimetric ferrozine-based assay and was expressed as µM/mg protein. The columns represent mean values and error bars indicate standard deviation (SD) of three independent determinations (n = 3). The measurements were carried out in quadruplicate in each independent experiment. An asterisk * marks p < 0.05 compared to the controls. A cross † indicates p < 0.05 compared to S. aureus LTA treatment and a double cross ‡ shows p < 0.05 compared to P. aeruginosa LPS treatment.

