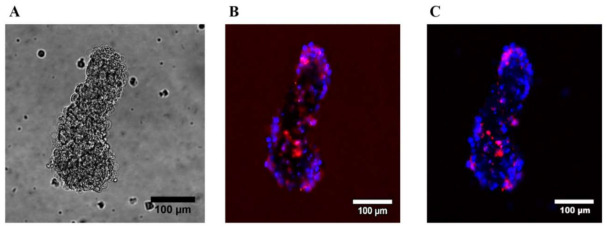
Figure 5.
Representation of a multicellular HUVEC aggregate after 24 h (S-24h) under nonadherent conditions. (A) Visualized by phase contrast microscopy. (B) Same HUVEC aggregate illustrated by cLSM labelled with Annexin-V/Alexa647 for apoptotic (red) and DAPI for dead cells (blue) as overlay of all 60 stacks using maximum projection mode. (C) Centre stack of the same HUVEC aggregate illustrated by cLSM.

