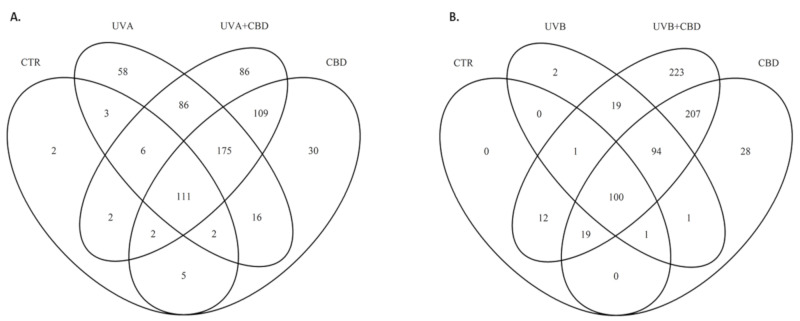
Figure 2.
Venn diagram showing protein distribution in the keratinocytes cultured in a three-dimensional culture model and treated with cannabidiol (4 μM) following UVA (30 J/cm2) (A) or UVB (60 mJ/cm2) (B) radiation. Data analyzed using RStudio (R version 3.6.2). The names and abundance of proteins are shown in Supplementary Table S1. Abbreviations: Ctr, control; CBD, cannabidiol.

