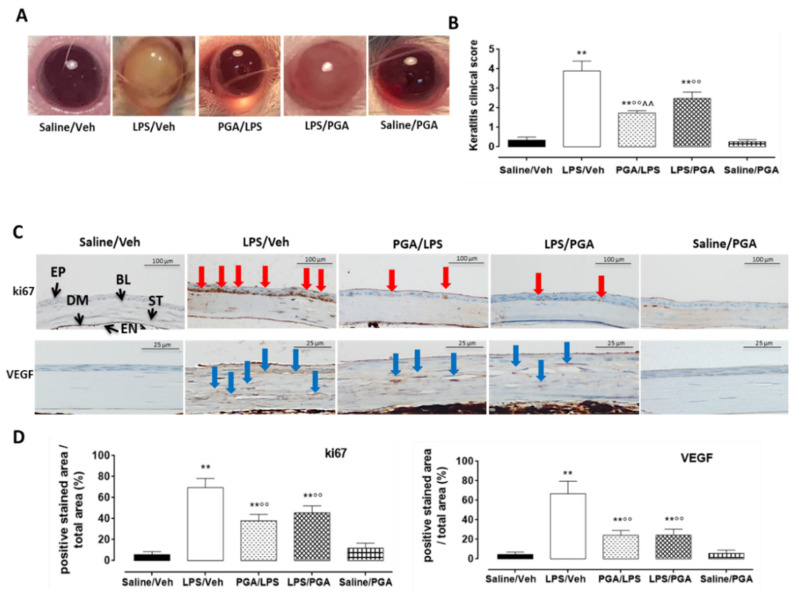
Figure 2.
(A) Representative images of keratitis development in CD1 mice cornea. (B) Keratitis clinical scores. Positive keratitis was scored as > 1. Statistical significance was assessed by one-way ANOVA, followed by Tukey’s multiple comparison test of N = 5 mice/group. Saline/Veh = mice receiving intrastromal injection of 2 μL PBS; LPS/Veh = mice receiving intrastromal injection of 2 μg LPS dissolved in 2 μL PBS; PGA/LPS = mice administered with PGA 5 mg/kg per os 30 min before LPS intrastromal injection; LPS/PGA = mice administered for three days with PGA 5 mg/kg per os, starting from 30 min after LPS intrastromal injection; Saline/PGA mice administered for three days with PGA 5 mg/kg per os, starting from 30 min after PBS intrastromal injection. ** p < 0.01 vs. Saline/Veh; °° p < 0.01 vs. LPS/Veh; ^^ p < 0.01 vs. LPS/PGA. (C) Representative immunohistochemical images for ki67 and VEGF corneal staining. (D) Ki67 and VEGF protein levels were reported as percentage (%) ± S.D. of positive stained area/total area. Statistical significance was assessed by one-way ANOVA, followed by Tukey’s multiple comparison test of N = 5 histological observations for each individual/group. EP = epithelium; BL = Bowman’s layer; ST = stroma; DM = Descemet membrane; EN = endothelium; Veh = vehicle; PBS = phosphate buffered saline; LPS = lipopolysaccharide; PGA = N-palmitoyl-D-glucosamine; red arrows = Ki67 positive stain (scale bar: 100 µm); blue arrows = VEGF positive stain (scale bar: 25 µm). ** p < 0.01 vs. Saline/Veh; °° p < 0.01 vs. LPS/Veh.

