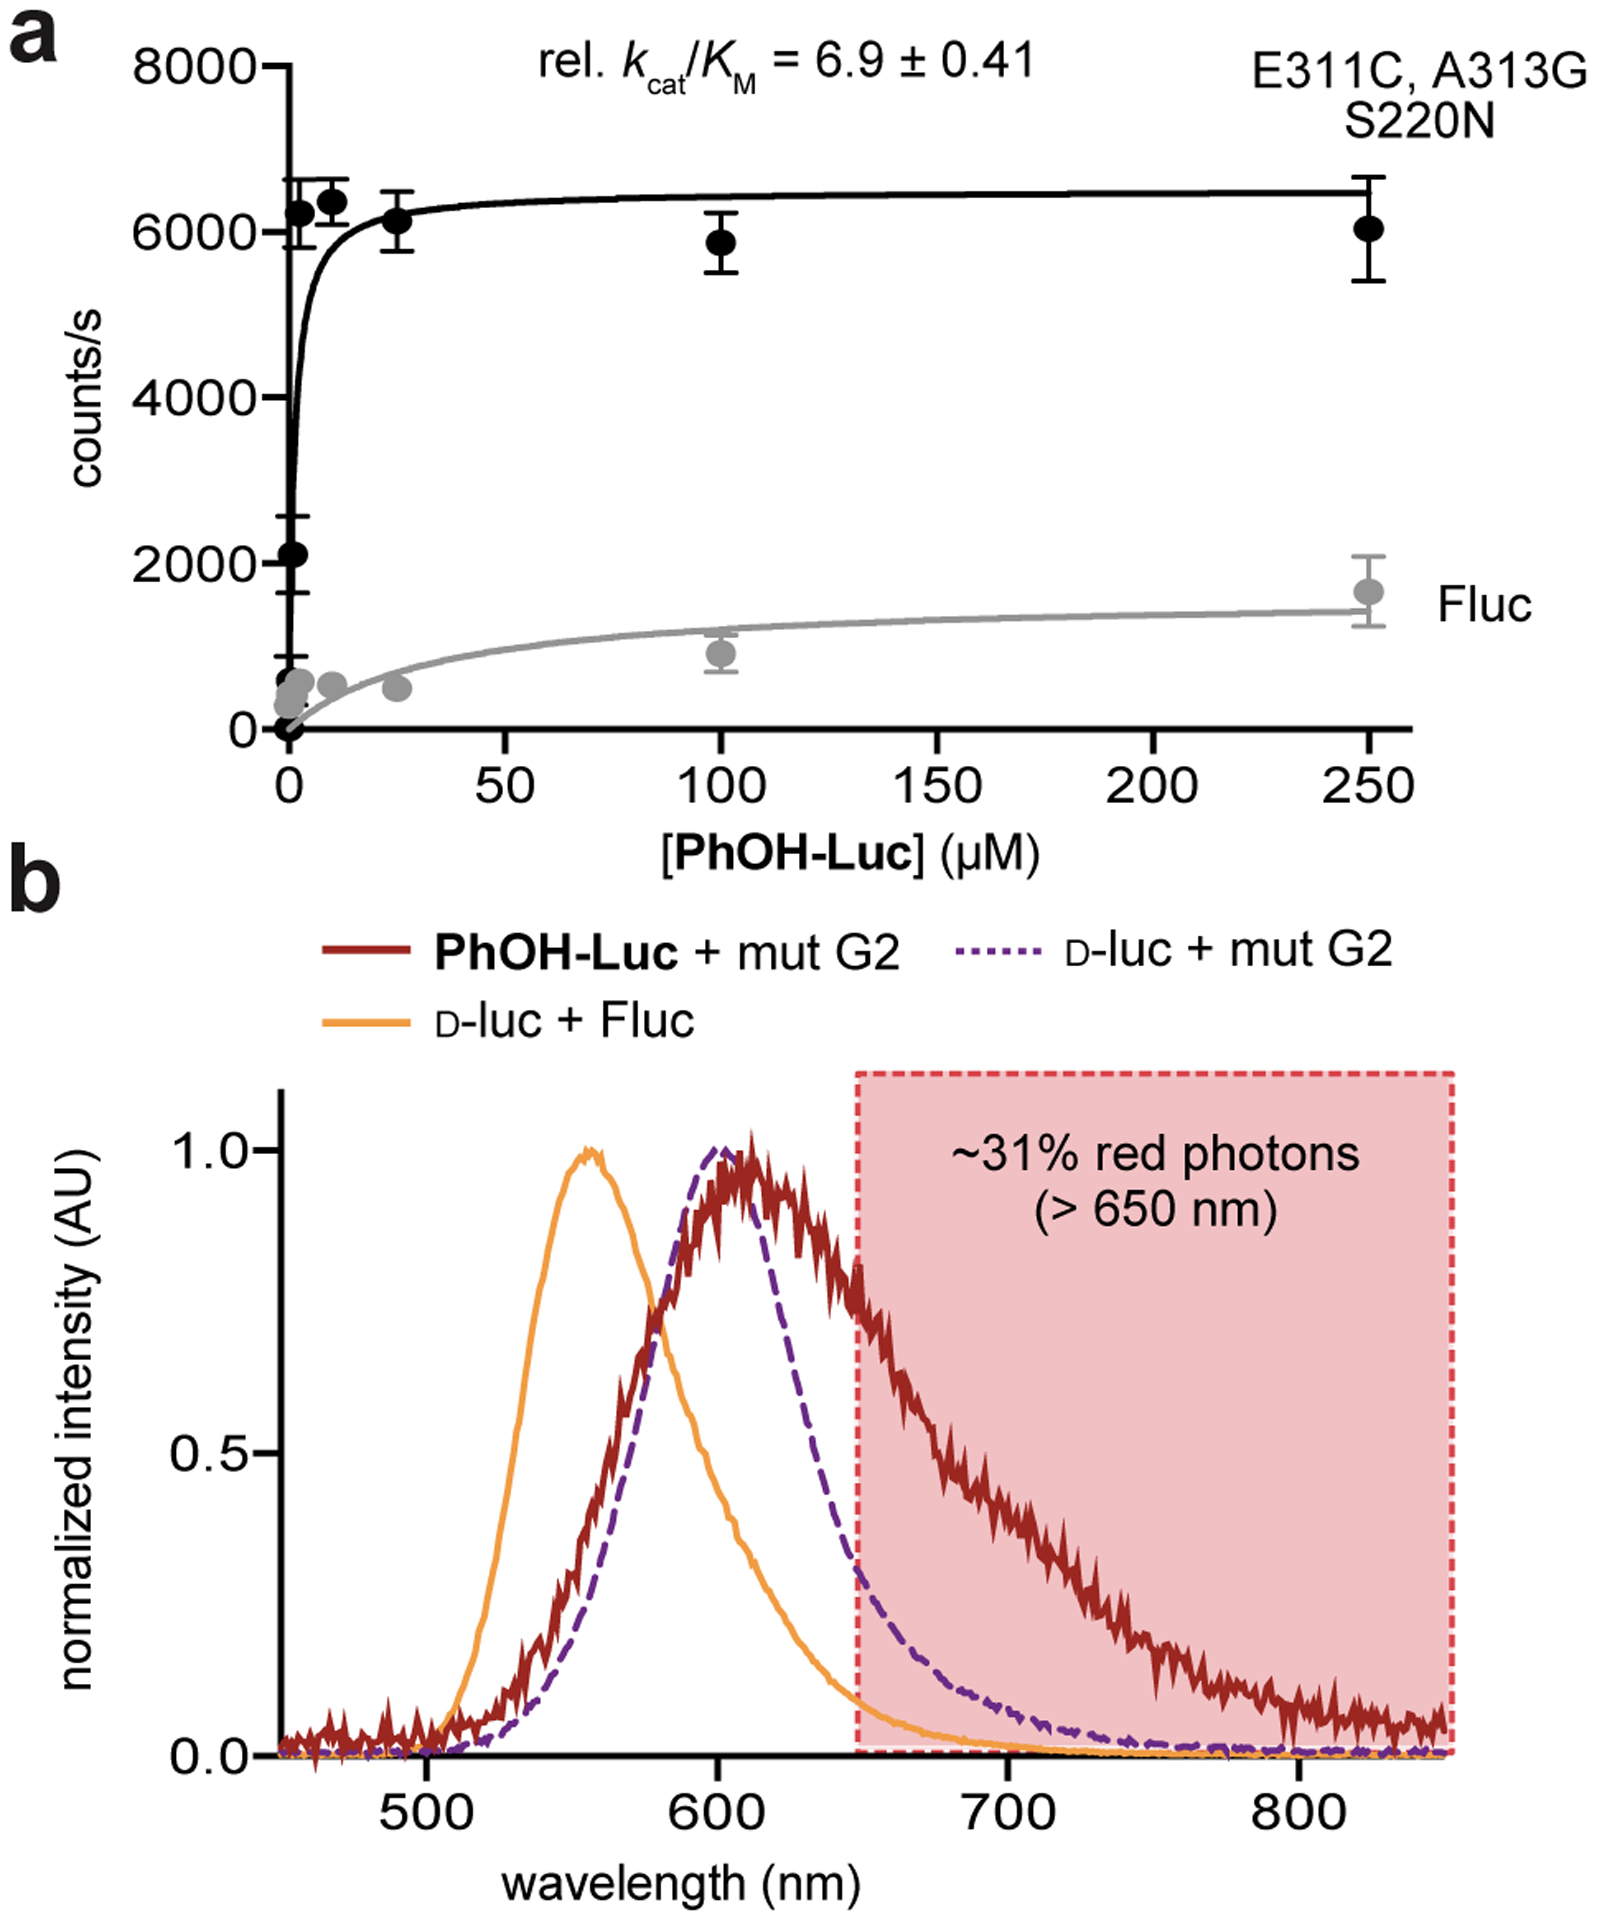
Figure 3. Biochemical analyses of lead mutant.

(a) Kinetic studies revealed that improved activity was likely due to increased substrate turnover. Kinetic parameters are apparent values, determined via measurements of initial rates of light emission over a range of substrate concentrations. Values were normalized to emission with Fluc. Error bars represent the standard error of the mean for n = 3 experiments. (b) Bioluminescence spectrum for PhOH-Luc with recombinant G2. Photons in the 650–850 nm region accounted for ~31% of the total emission.
