
Figure 6. Quadruple bioluminescence imaging.
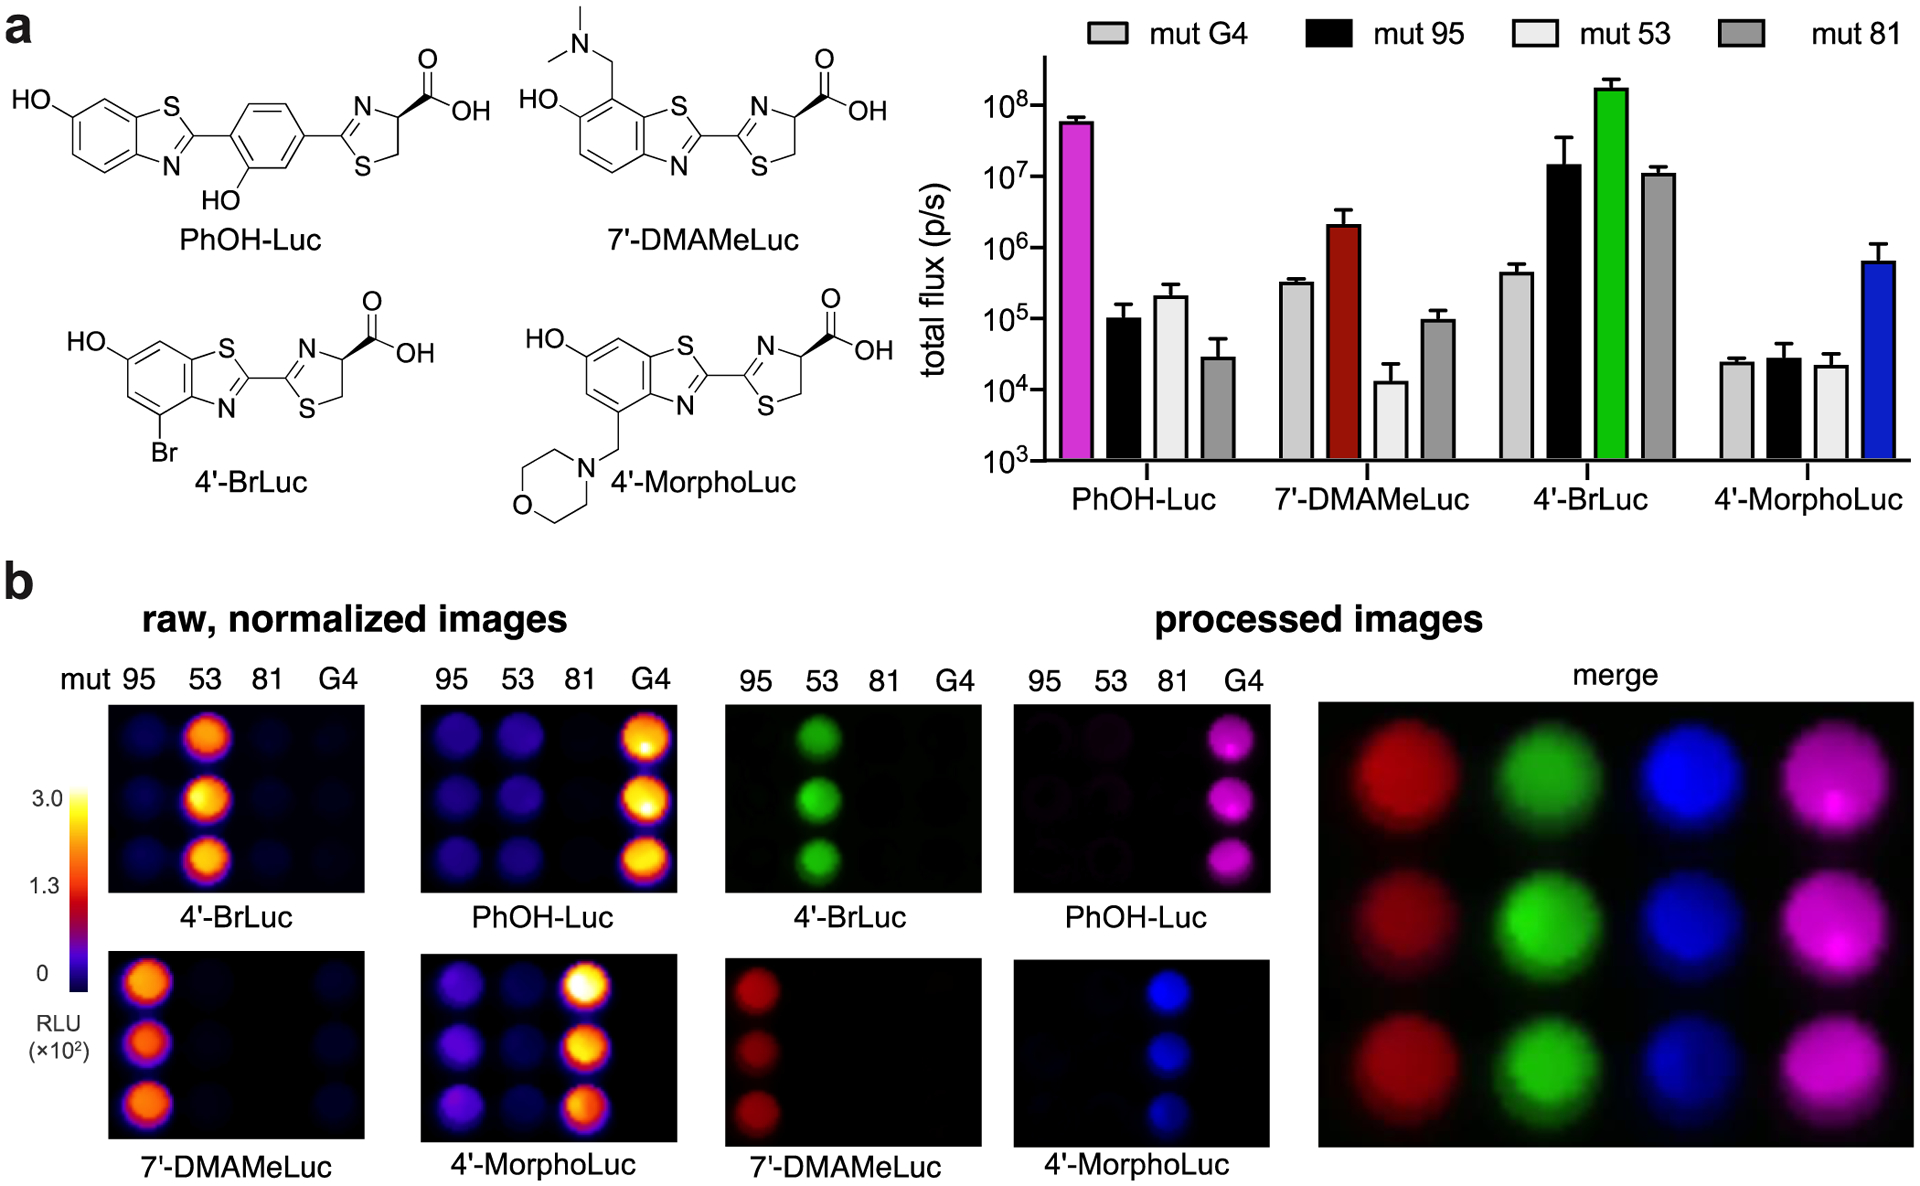
(a) Mutant luciferases were expressed in bacteria. Comparable levels of expression were observed (Figure S17). Cells were lysed, then distributed across four 96-well plates (in a 3×4 matrix). Saturating doses of the corresponding luciferin analogs were administered ([PhOH-Luc] = 250 μM, [7′-DMAMeLuc] = 250 μM, [4′-BrLuc] = 100 μM, [4′-MorphoLuc] = 250 μM). Images were acquired, and the raw emission data were stacked and unmixed. (b) Unmixed images from (a) depicting a quartet of unique luciferase-luciferin pairs. Emission intensities are plotted as total photon flux values. Error bars represent the standard error of the mean for n = 3 experiments.