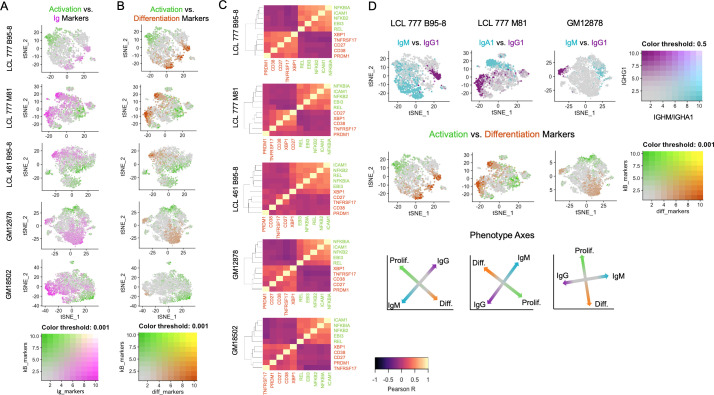
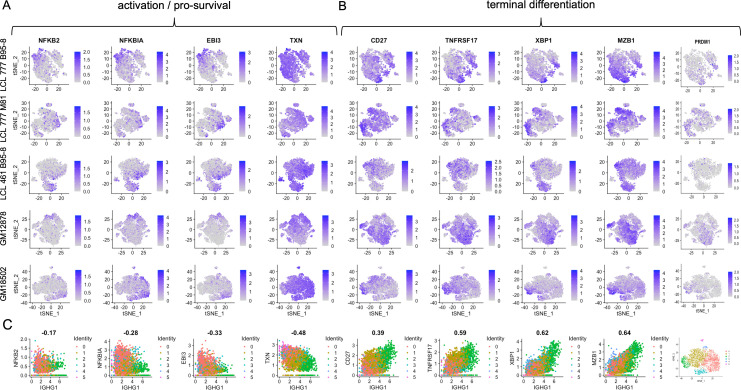
Figure 2. Lymphoblastoid cell lines (LCLs) exhibit anticorrelated expression gradients of activation and differentiation genes.
(A) Inverse expression gradients of immunoglobulin genes (IGHM, IGHA1, and IGHG1) in magenta and NFκB targets (NFKB2, NFKBIA, EBI3, ICAM1, and BCL2A1) and TXN in green. (B) Similar inverse gradients of NFκB targets in green and B cell differentiation markers (TNFRSF17, XBP1, MZB1, CD27, and CD38) in orange. (C) Pearson correlation maps and hierarchical clustering reveal negative correlation of differentiation (orange) and activation (green) gene sets and positive correlations between genes within each set. (D) In LCLs comprising multiple immunoglobulin isotypes, heavy chain class and differentiation/activation gradients constitute orthogonal (independent) axes of phenotypic variance.

