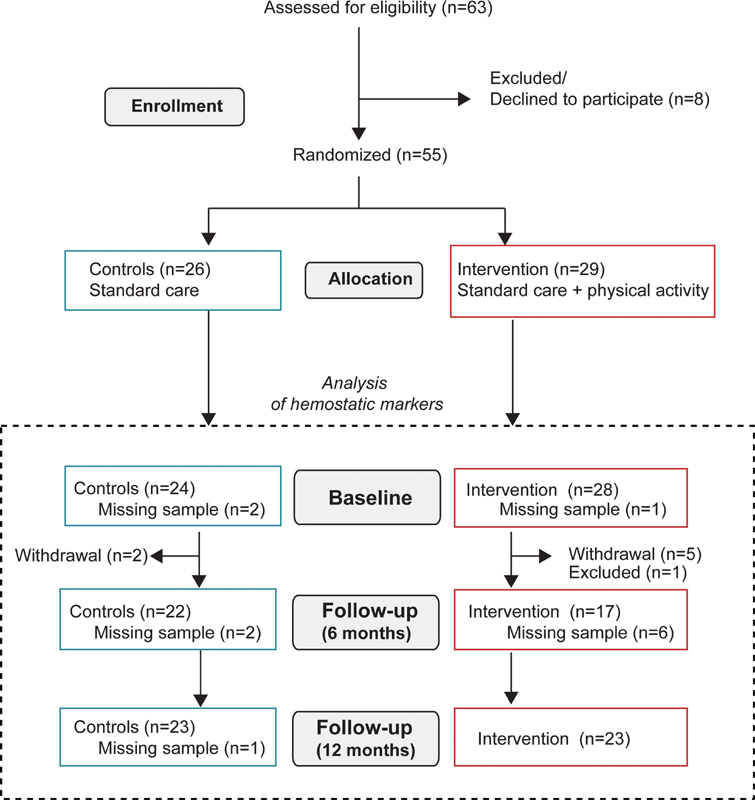
Fig. 1.

Flow chart showing the inclusion process of the patients in the study. Maximum number of available samples for the analyses of hemostatic markers is indicated. Note that the number of missing samples was higher for some of the hemostatic markers, as indicated in the tables.
