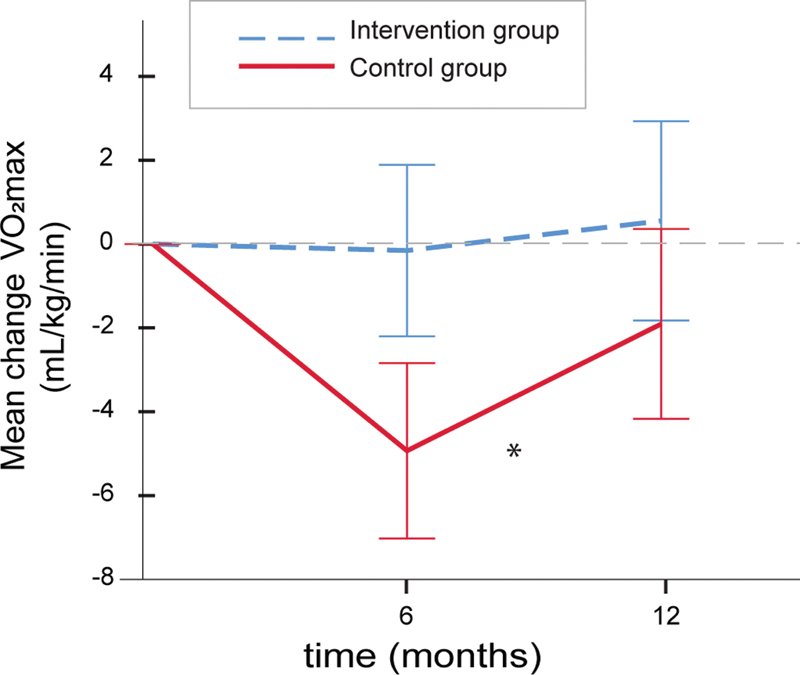
Fig. 2.

Maximal oxygen uptake in the two study groups during the study period. The lines show mean (95% confidence intervals) differences from baseline in VO 2max levels in the intervention group (blue stippled line, n = 29/22/21 at 6 and 12 months, respectively) and the control group (red line, n = 25/24/23 at 6 and 12 months, respectively). The asterisk denotes a significant difference (mixed model adjusting for baseline values,* p = 0.005) between the two study groups with regard to the main group effect.
