
4.
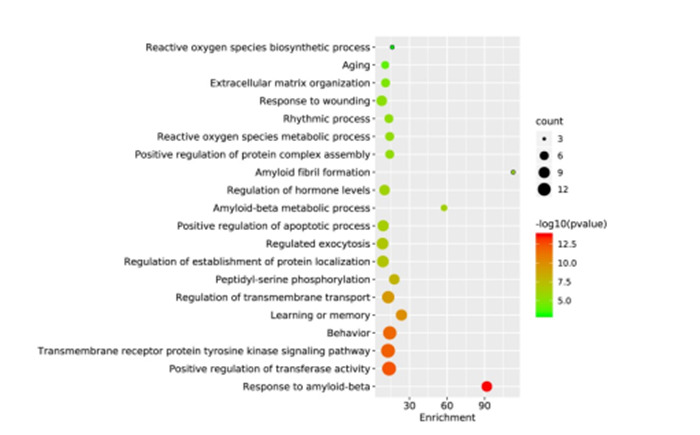
GO富集分析生物学过程Top20气泡图
Top 20 bubble chart of biological process of GO enrichment analysis. The X-axis represents the enrichment factor, the bubble size represents the count of targets enriched in terms and the color represents the P value.
Official websites use .gov
A
.gov website belongs to an official
government organization in the United States.
Secure .gov websites use HTTPS
A lock (
) or https:// means you've safely
connected to the .gov website. Share sensitive
information only on official, secure websites.
GO富集分析生物学过程Top20气泡图
Top 20 bubble chart of biological process of GO enrichment analysis. The X-axis represents the enrichment factor, the bubble size represents the count of targets enriched in terms and the color represents the P value.