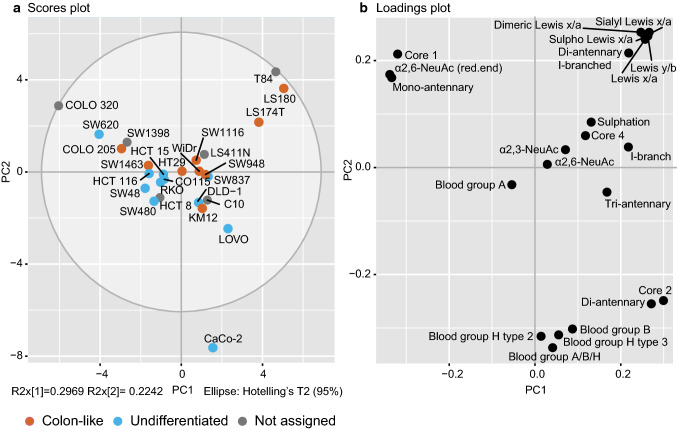
Fig. 3.
PCA based on relative abundance (%) of calculated structural glycan features. A separation between colon-like and undifferentiated cell lines is illustrated in the a PCA score plot of PC1 against PC2. b The PCA loading plot displays the variables that drive the separation in the PCA model. The top three principal components explain 68.58% of the variation within the data. Biological and technical replicates were averaged per cell line

