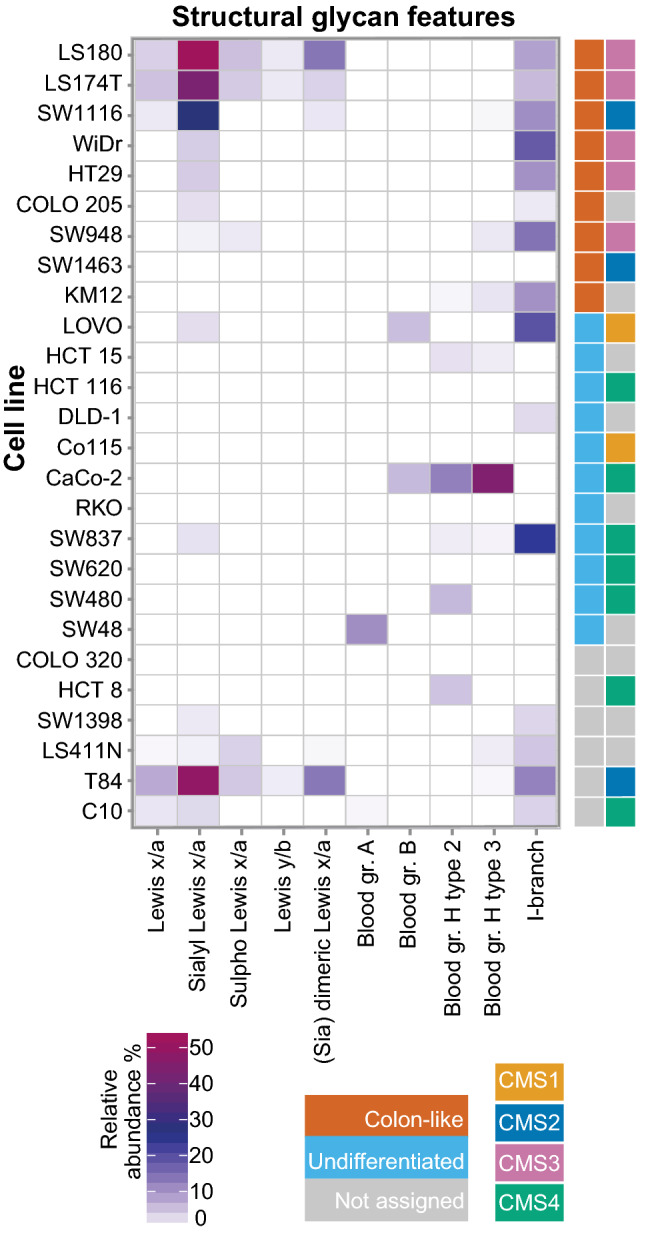
Fig. 4.

Relative abundance of structural glycan features per cell type. Geometrical tile of the relative abundance (%) of the calculated structural glycan features (x axis) and cell line type (y axis). Different classifications of the cell lines are displayed with colour codes based on gene expression (colon-like in red and undifferentiated in light blue) and consensus molecular subtypes (CMS1 in yellow, CMS2 in dark blue, CMS3 in pink, and CMS4 in green). Non-assigned cell lines were marked in grey for the gene expression as well as for the CMS status
