Fig. 2.

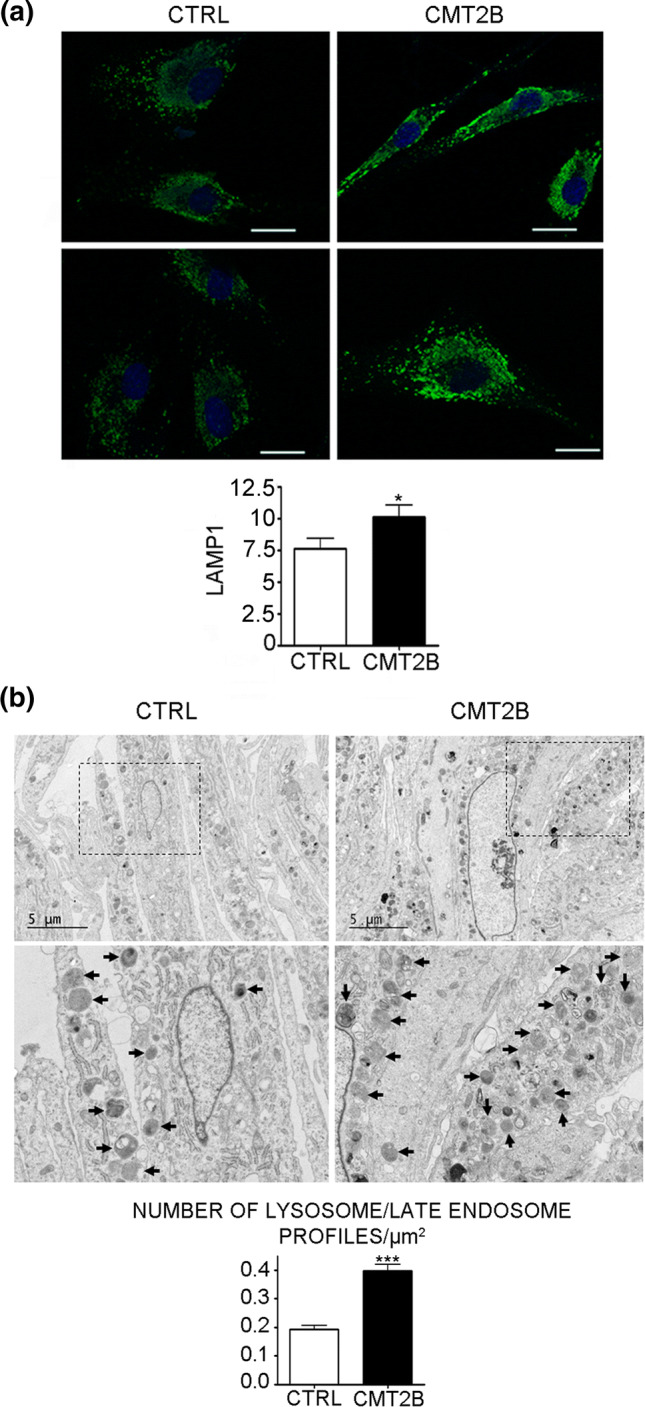
Electron microscopy of control and CMT2B patient 1 fibroblasts. a Control and CMT2B fibroblasts from patient 1 carrying the RAB7V162M mutation were fixed and immunolabeled with anti-LAMP1 followed by Alexa488-conjugated secondary antibody, while nuclei were stained with DAPI. Bars 20 µm. LAMP1 intensities of at least 50 cells per sample were measured using ImageJ. Graphs were generated with GraphPad. Mann–Whitney U test was used for statistical analysis and control fibroblasts were selected as referring sample. *p < 0.05. b The boxed areas are shown at higher magnification in the lower panels. Arrows indicate some of the lysosomes. Bars 5 µm. Graphs of lysosome number quantification were generated with GraphPad. Mann–Whitney U test used for statistical analysis and control fibroblasts were selected as referring sample. ***p < 0.001
