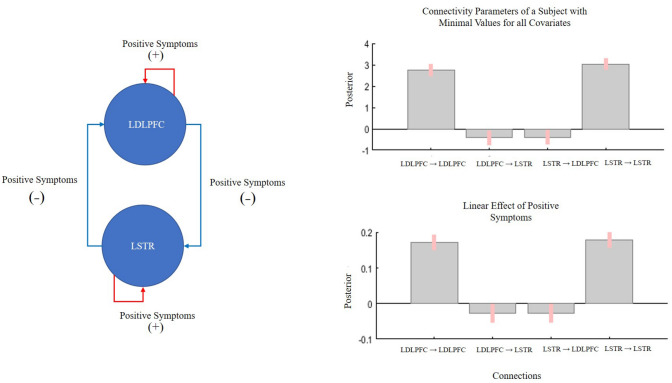
Fig. 3.
Parameter estimates of the winning (delusions) model. Bar graphs represent the rate of change of connectivity strength of a subject with the lowest values of all covariates (top) and the linear effect of positive symptoms—after accounting for all covariate of interests—across subjects. Left circuit shows a visual representation of the effect of positive symptoms on connectivity strength. Symptoms severity increases within region GABAergic activity and decreases between-region glutamatergic influence

