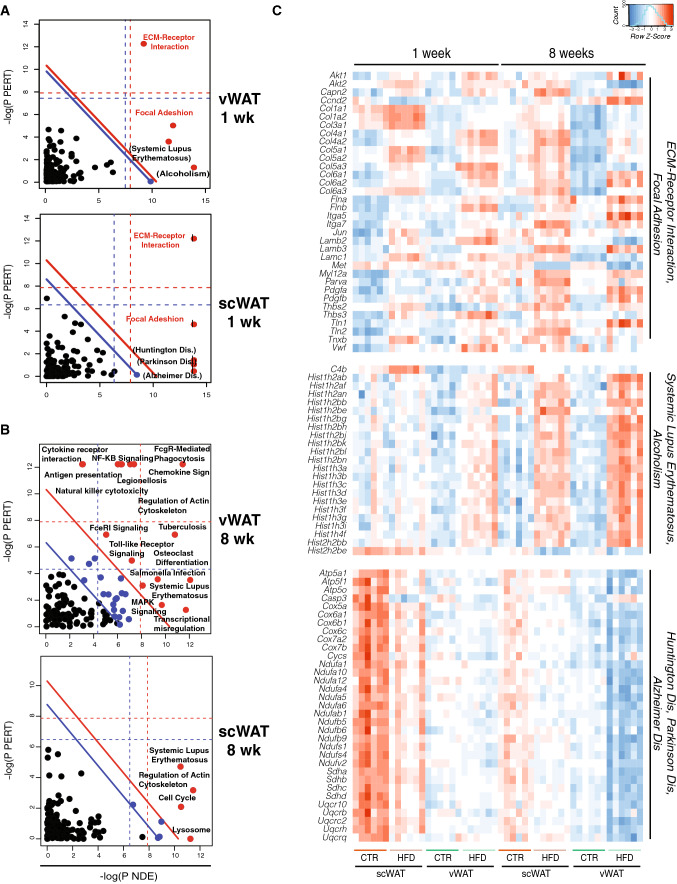
Fig. 2.
Transcriptomic response to HFD feeding of visceral and subcutaneous adipose tissue is characterized by the modulation of distinct pathways. a, b Two-dimensional plots illustrating the signaling pathway impact analysis (SPIA) performed on the RNAseq data obtained from vWAT and scWAT after 1 week (a) and 8 weeks (b) of HFD. The X-axis shows the over-representation evidence (PNDE), while the Y-axis shows the perturbation evidence (PTERT). Each pathway is represented by a dot. Pathways above the oblique red line (red dots) are significant at 5% after Bonferroni correction, while those above the oblique blue line are significant at 5% after FDR correction (black blue dots). The vertical and horizontal thresholds represent the same corrections for the two types of evidence considered individually. Pathways with a log(PNDE) higher than 15 are marked by an additional small vertical bar. c Heatmap of log2 expression value of shared genes in the “ECM–receptor interaction” and “Focal adhesion”, “Systemic lupus erythematosus” and “Alcoholism” and “Parkinson dis.”, “Huntington dis.” and “Alzheimer dis.” pathways at 1 and 8 weeks in both vWAT and scWAT

