Fig. 3.
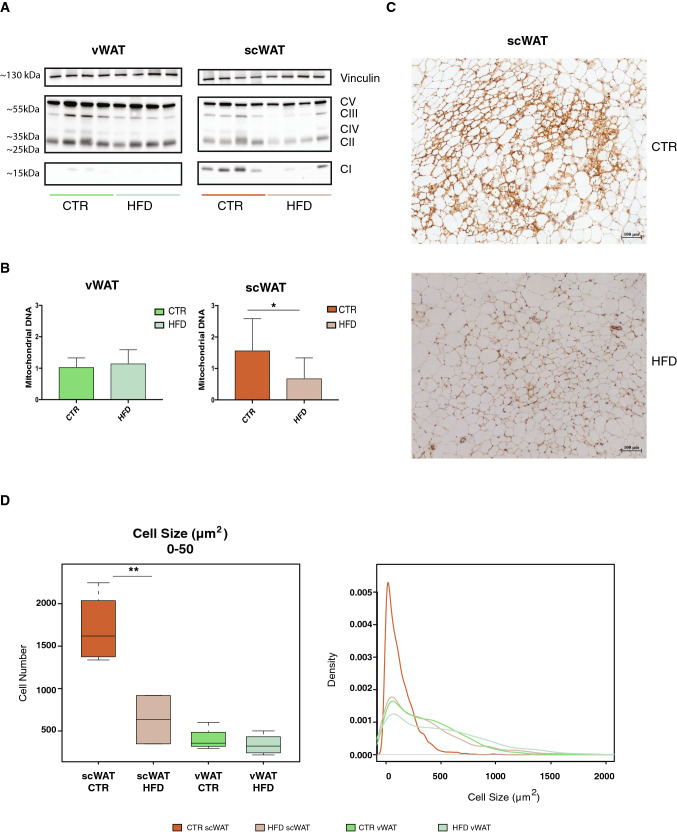
The early response to overnutrition in scWAT is characterized by loss of beige adipocytes. a Western blot for total OXPHOS proteins in scWAT from controls and HFD (n = 4) after 1 week. Vinculin is used as a loading control. b Mitochondrial DNA quantification. The y-axis represents the ratio between expression of a mitochondrial 16S and a genomic gene (ln11). c Representative images of UCP1 immunohistochemistry in control (top) and 1-week HFD (bottom). d)Cell size distribution calculated on sections of vWAT and scWAT from controls and 1-week HFD-treated mice (n = 5). Left panel: quantification of cells ranging from 0 to 50 µm2. Right panel: the y-axis shows the probability density function for the kernel density estimation and the x-axis the cell size, ranging from 0 to 2000 µm2 (n = 5). Data are represented as mean ± SD. Significance between the indicated groups was calculated using a two-tailed Student’s t test. *(p value < 0.05), **(p value < 0.01)

