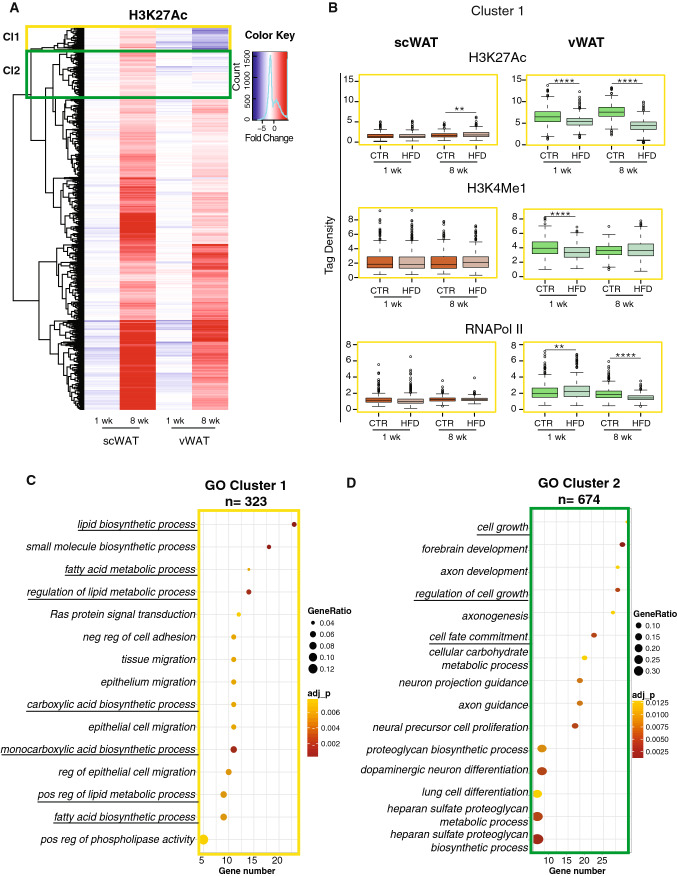
Fig. 5.
scWAT and vWAT show distinct acetylation profiles in genomic regions linked to lipid metabolism and cell fate upon HFD feeding. a ChIP-seq cluster analysis. Hierarchical cluster analysis and heatmap showing the Log fold change (LogFC) of H3K27Ac on 5984 genomic regions, selected based on the significant alteration of their H3K27Ac signals when comparing control and HFD vWAT at 8 weeks. The yellow and the green rectangles highlight the two clusters of interest. b Box plot of average tag density on the 359 regions in cluster 1 (yellow frame) for RNAPol II, H3K4me1 and H3K27Ac. Significance between the indicated groups was calculated using a two-tailed Student’s t test. *(p value < 0.05), **(p value < 0.01), ****(p value < 0.0001). c, d Pathway enrichment analysis performed on genes annotated in clusters 1 and 2, respectively. In each panel, the x-axis shows the number of genes found in the cluster belonging to the pathway. The dots are colored based on the significance of each pathway and the size of the dots represents the ratio between the number of genes in the cluster and in the pathway

