
FIGURE 5.
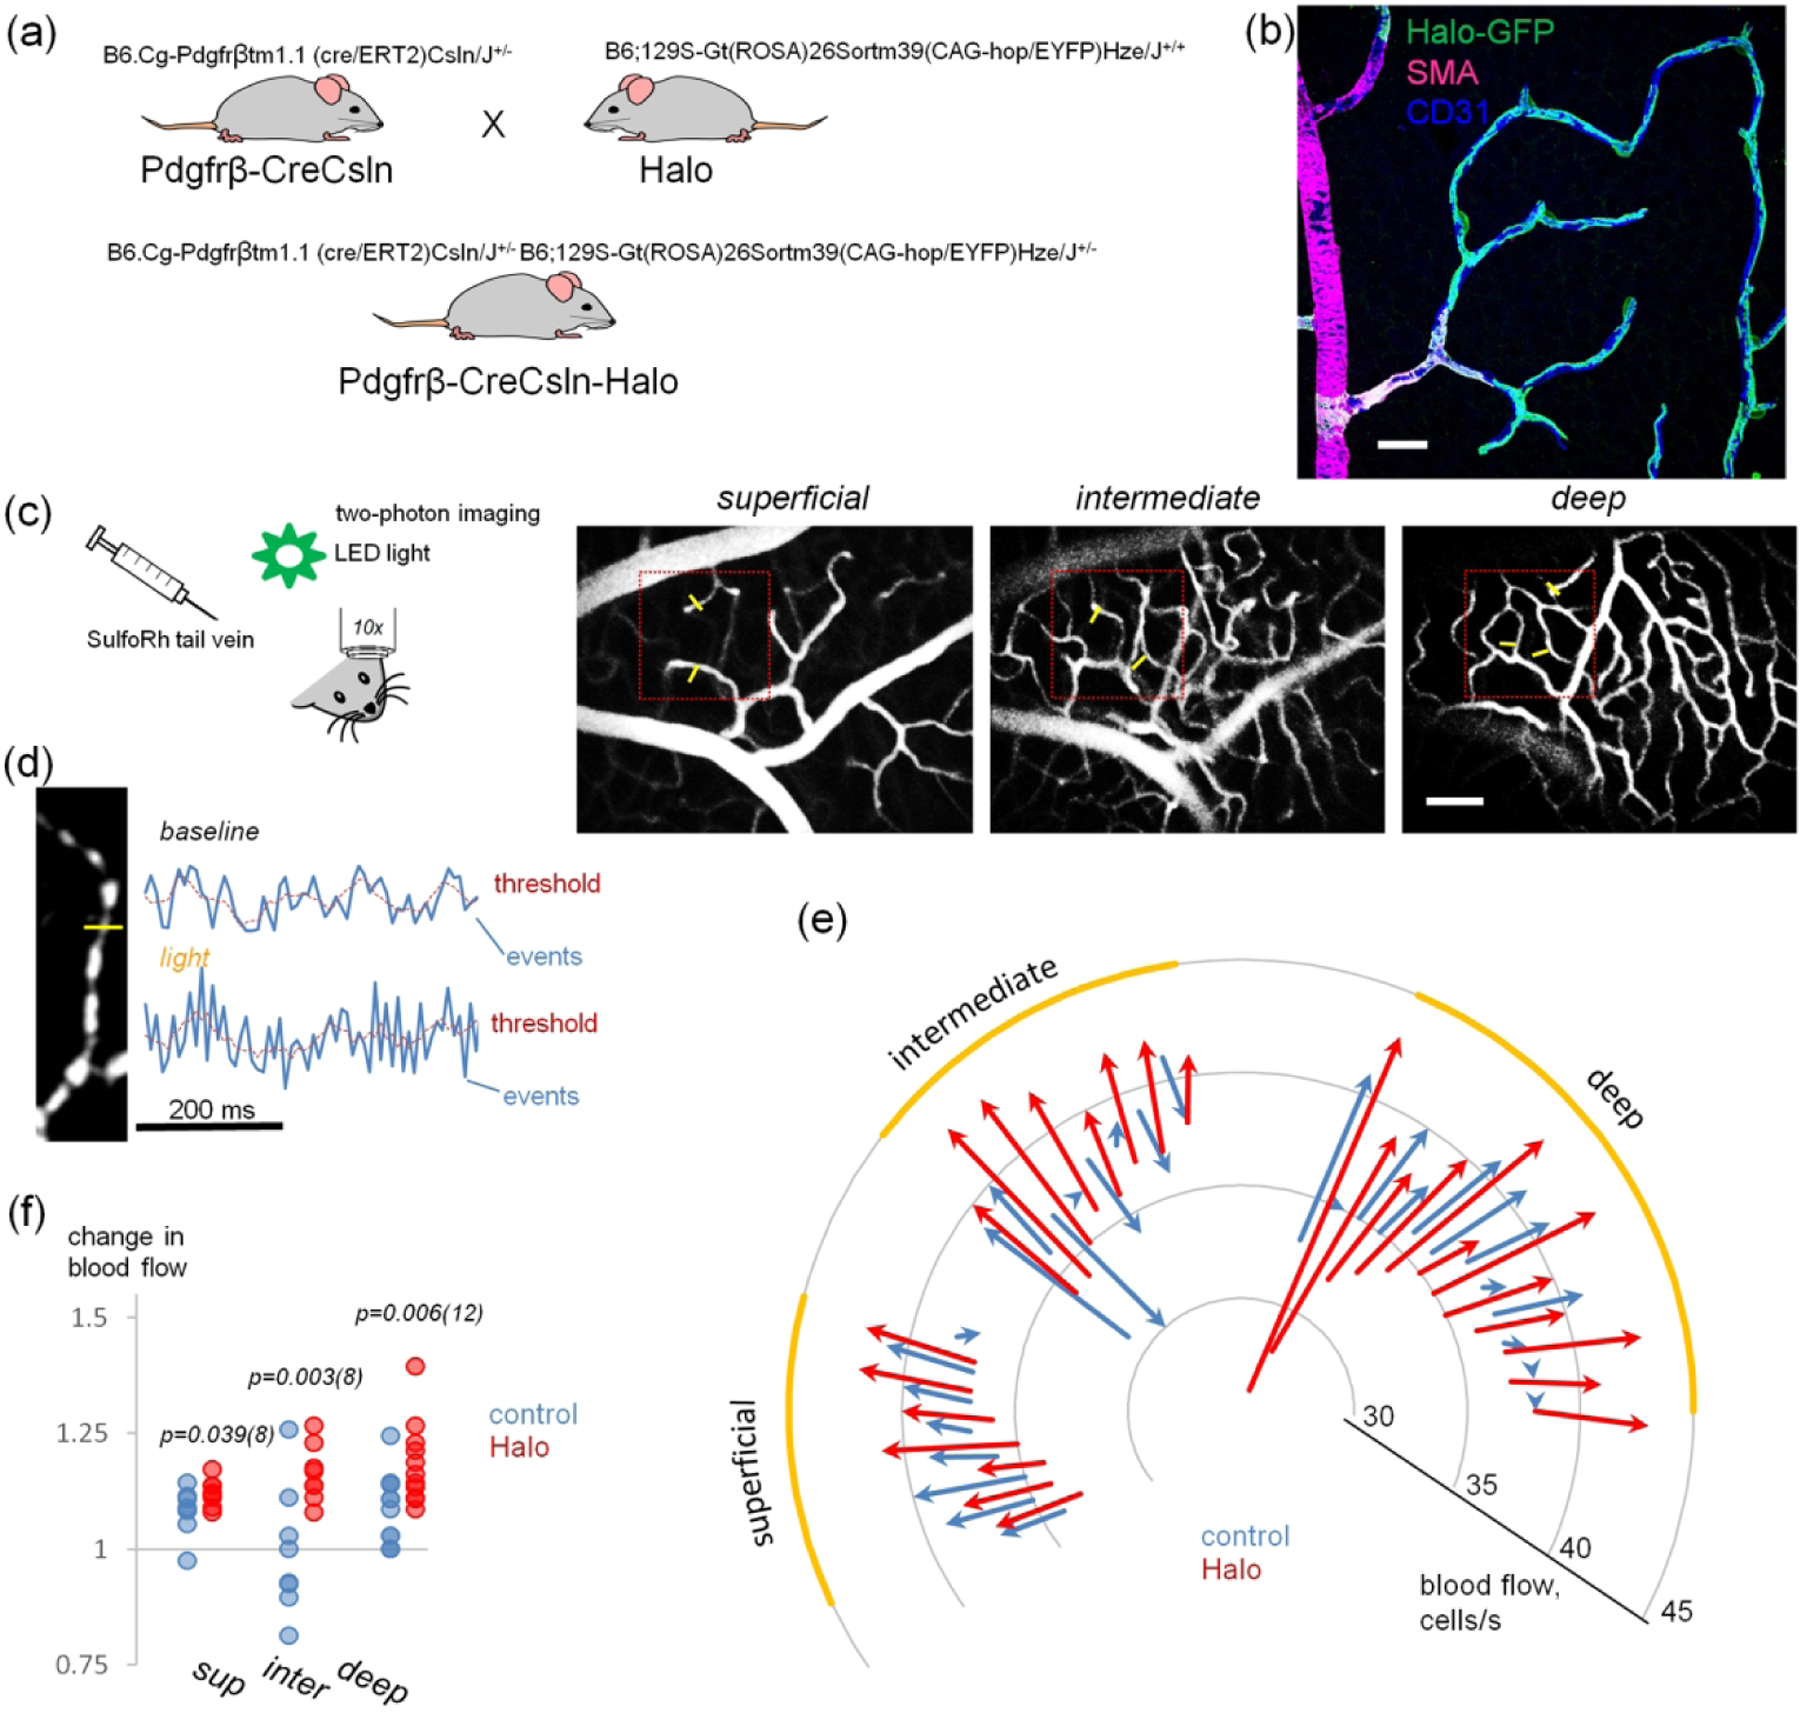
Targeted expression of Halorhodopsin in retinal pericytes for optogenetic boost of capillary blood flow. (a) Creation on Pdgfrb-CreCsln-Halo mouse. (b) Predominant expression of Halorhodopsin by contractile cells in microvascular regions. Retinal wholemount from B6.Cg-Pdgfrβtm1.1 (cre/ERT2)Csln/J+/− and B6;129S-Gt(ROSA)26Sortm39(CAG-hop/EYFP)Hze/J+/− mice expressing Halorhodopsin after Cre-induction via tamoxifen eye drops. Scale bar 25 μm. (c) In vivo imaging of retinal vasculature and blood flow after tail vein infusion of sulforhodamine101. Three vascular layers are clearly distinguishable. The actual area of blood flow with fast scan is outlined by the red square. Yellow bars indicate cross-sections through capillaries where blood flow was measured. Scale bar 25 μm. (d) Calculation of blood flow was made by analyzing time-lapse images of individual capillaries. Blood cells appear dark relatively to sulforhodamine101-labeled plasma. At the capillary cross-section marked by yellow line, the fluorescence intensity profile was created (blue line on the graph) and passing blood cell events were registered as peaks falling below the threshold. (e) Graphic representation of capillary blood flow before and after light stimulation at each capillary sample across three distinct vascular layers in halo and control animals. A vector indicates changes of blood flow in an individual capillary at the baseline (start) and after light stimulation (end). An arrow from the center indicates increase in blood flow, and an arrow towards the center indicates decrease in blood flow. Four eyes per group. (f) Optogenetic stimulation produced a robust increase in capillary blood flow. Ratios of capillary blood flow after light stimulation to the baseline in wt (blue) and Halorhodopsin-expressing retinas (red) were significantly different. Four eyes per group. Numbers of measured capillaries are below data points; TTEST significances are above.