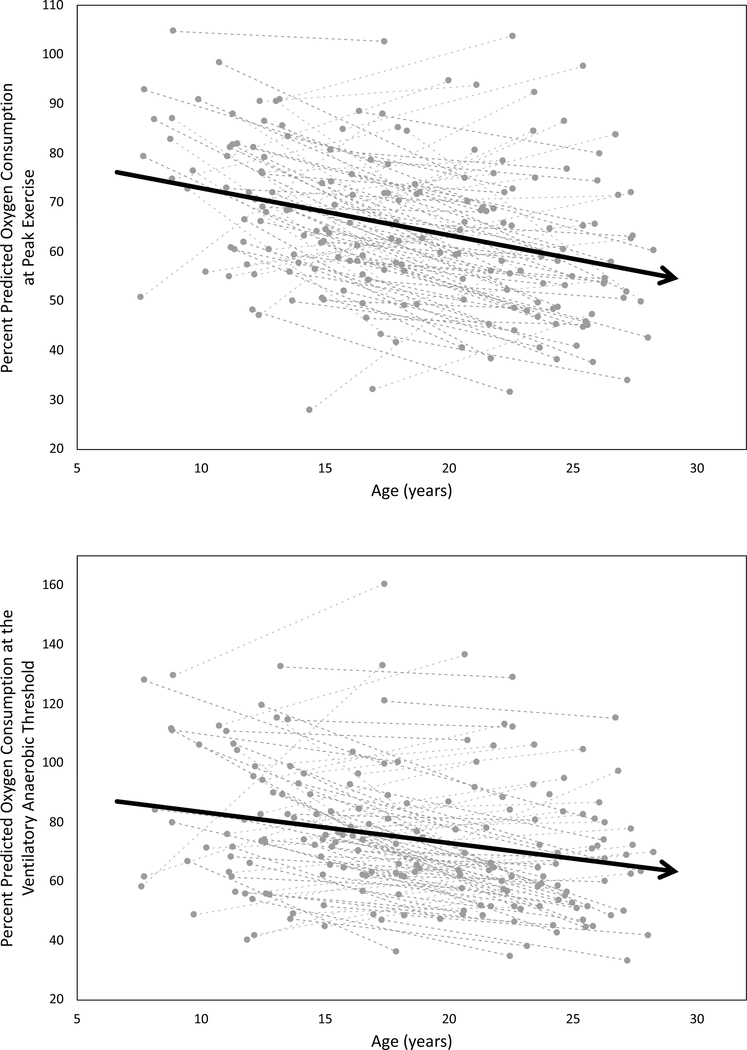
Fig. 2.
Longitudinal percent-predicted exercise data for individual subjects with a paired maximal tests (VO2) and b paired data at the ventilatory anaerobic threshold (VAT). The dashed lines represent each participant, while the solid lines with arrows represents the trend line for the cohort. Both plots demonstrate a decline in exercise capacity from Fontan 1 to Fontan 3

