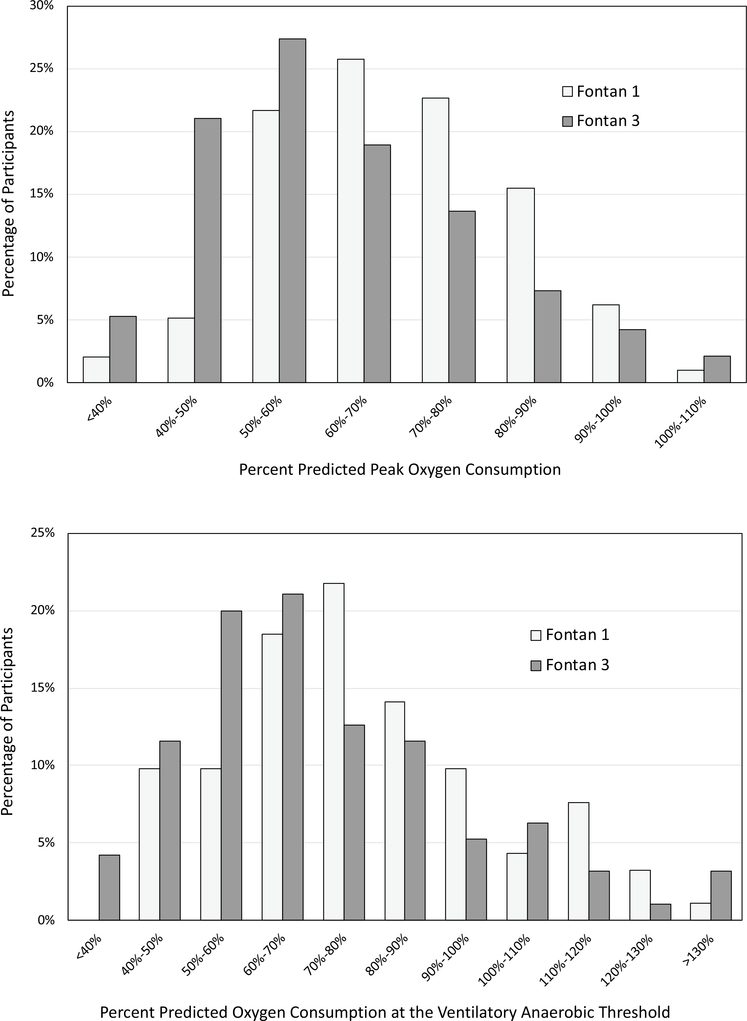
Fig. 3.
Histogram of exercise performance oxygen consumption at a peak exercise and b oxygen consumption at the anaerobic threshold. The y-axis is percentage of patients and the x axis is percent predicted for age and gender. The light bars represent data from Fontan 1 while the dark bars represent data from Fontan 3. Both histograms demonstrate a shift toward lower performance from Fontan 1 to Fontan 3

