
Figure 3∣. RQC and ISR do not appear to directly compete with each other.
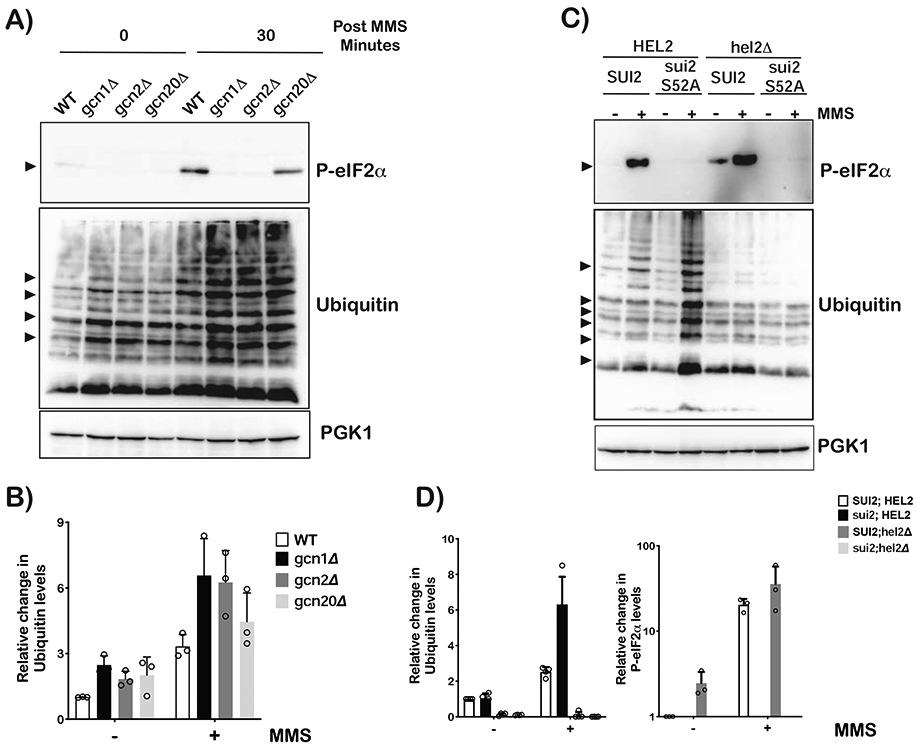
A) Western-blot analysis used to follow eIF2α phosphorylation and ubiquitination as a function of MMS in wild-type, gcn1Δ, gcn2Δ and gcn2Δ cells. B) Bar-graph analysis of three independent immuno blots similar to the one shown in (A), used to follow the relative levels of indicated ubiquitin bands in the denoted samples. C) Western-blot analysis of total protein isolated from wild-type, sui2-S52A (eIF2α cannot be phosphorylated), hel2Δ and sui2-S52A;hel2Δ cells that had been grown in the absence or presence of 0.1% MMS for 30 minutes. D) Relative levels of ubiquitin bands and phospho-eIF2α in the indicated cells, respectively. Analysis was carried out on three independent immuno blots similar to the one shown in (C). For all bar graphs, plotted is the mean values determined from three biological repeats with the error bars representing the standard deviation around it.