
Figure 1. HIF1a Accumulation Impairs the Induction of Oligodendrocytes from OPCs.
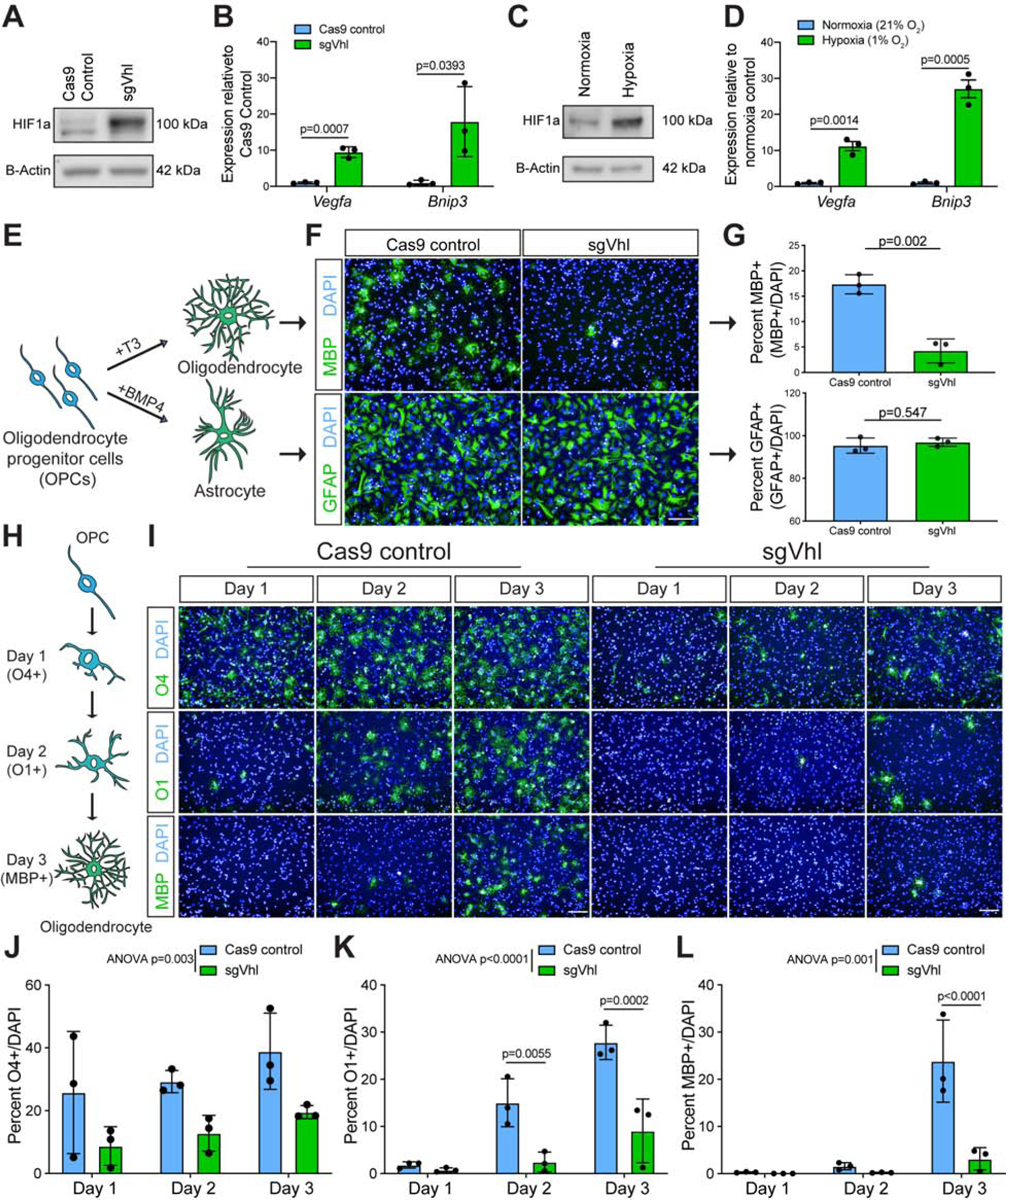
(A) Western blot of HIF1a in sgVhl and Cas9 control OPCs.
(B) qRT-PCR of Vegfa and Bnip3 in Cas9 control (in blue) and sgVhl (in green) OPCs. Data are presented as mean ± SEM from 3 biological replicates.
(C) Western blot of HIF1a in hypoxic (1% O2) and normoxic OPCs.
(D) qRT-PCR of Vegfa and Bnip3 in hypoxic (in green) and normoxic (in blue) OPCs. Data are presented as mean ± SEM from 3 biological replicates.
(E) Schematic of the two in vitro differentiation schemes directing OPCs to either oligodendrocytes or astrocytes.
(F) Representative images of Cas9 control and sgVhl oligodendrocytes (MBP+ in green) and astrocytes (GFAP+ in green). Nuclei are marked by DAPI (in blue). Scale bar, 100μm.
(G) Quantification of the percentage of oligodendrocytes (MBP+ cells / DAPI) and astrocytes (GFAP+ cells / DAPI) formed from sgVhl (in green) and Cas9 control OPCs (in blue). Data are presented as mean ± SD from 3 independent biological replicates. p-values were calculated using Student’s two-tailed t-test.
(H) Schematic illustrating acquisition of early (O4), intermediate (O1) and late (MBP) oligodendrocyte markers during in vitro oligodendrocyte differentiation.
(I) Representative images of early (O4+ in green), intermediate (O1+ in green) and late (MBP+ in green) oligodendrocytes during days 1, 2, and 3 of differentiation of Cas9 control and sgVhl OPCs. Nuclei are marked by DAPI (in blue). Scale bars, 100μm.
J-L) Quantification of the percentage of early O4+ (J), intermediate O1+ (K), and late MBP+ (L) oligodendrocytes in sgVhl (in green) and Cas9 control OPCs (in blue) at days 1, 2, and 3 of differentiation. Data are presented as mean ± SD from 3 independent biological replicates. p-values were calculated using two-way ANOVA (reported as ANOVA p=) for overall group differences and Sidak’s multiple comparisons test for individual timepoint differences.
p-values for qRT-PCRs were calculated using Student’s two tailed t-test.
See also Figure S1.