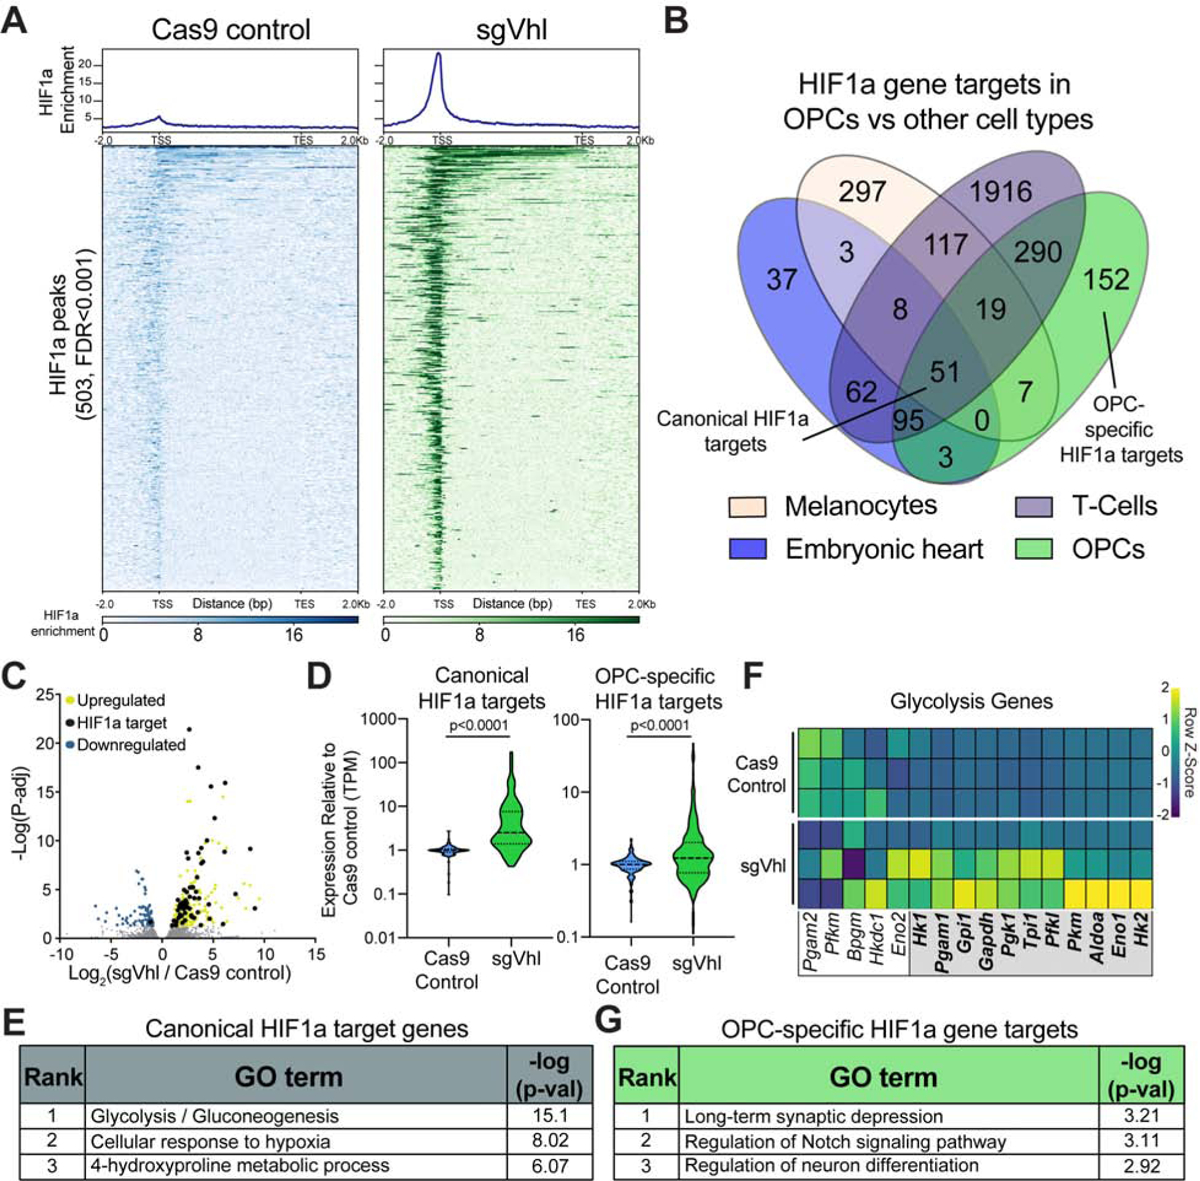
Figure 2. HIF1a directly upregulates unique targets in OPCs.

(A) Aggregate binding profile and heatmap of 503 HIF1a peaks (FDR<0.001) in sgVhl OPCs within 2Kb of the transcription start site (TSS) and transcription end site (TES) of the closest expressed gene in Cas9 control and sgVhl OPCs. See also Table S1 for full list of peaks.
(B) Venn diagram of direct HIF1a target genes in diverse mouse tissues overlapped with HIF1a targets in OPCs. See also Table S2 for full list of peaks.
(C) Volcano plot of genes that significantly increase and decrease in yellow and blue respectively (P-adj < 0.05) in sgVhl OPCs compared to Cas9 control OPCs with direct targets of HIF1a in black. Gray dots are genes not significantly different between conditions. Data are from 3 biological replicates.
(D) Violin plots of expression data (TPM) normalized to Cas9 control OPCs for canonical and OPC-specific HIF1a targets in Cas9 control (in blue) and sgVhl (in green) OPCs. Bold dashed line represents the median with the thin dashed lines representing the upper and lower quartiles. p-values were calculated using the Mann-Whitney test.
(E) Gene ontology (GO) analysis of shared canonical targets of HIF1a. Table shows the rank of the GO term along with −log(p-value).
(F) Heatmap of row normalized expression of glycolysis genes (TPM) between Cas9 control and sgVhl OPCs. Genes in the gray box are direct targets of HIF1a. Each row represents a biological replicate.
(G) Gene ontology (GO) analysis of OPC-specific HIF1a target genes. Table shows the rank of the GO term along with −log(p-value).
See also Figure S2.
