
Figure 5. Chemical Inhibition of MEK/ERK Increases Oligodendrocyte Formation from sgVhl OPCs.
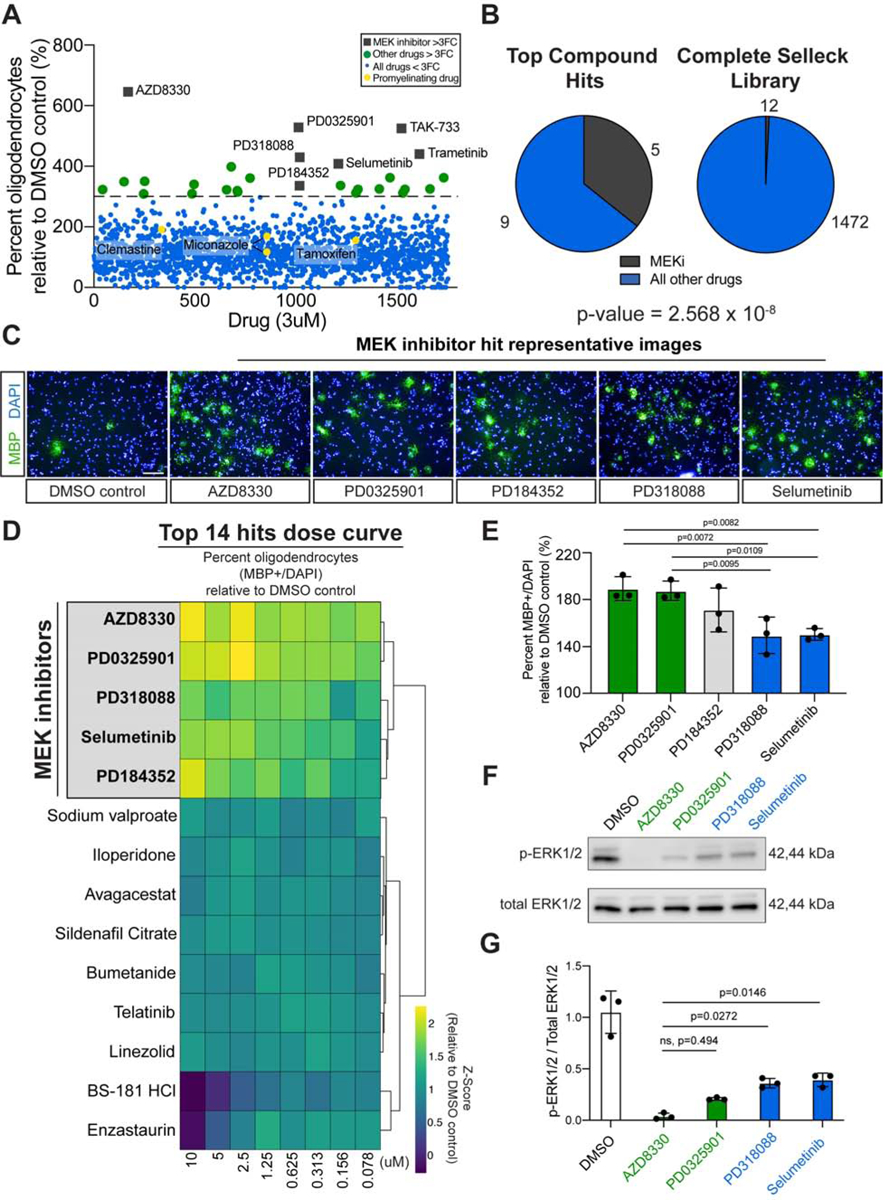
(A) Primary bioactives library screen showing the effect of 1753 molecules on percentage of oligodendrocytes (MBP+ cells/ total DAPI) formed by sgVhl OPCs relative to DMSO treated sgVhl OPCs. The dotted line represents a 3-fold increase in oligodendrocyte formation and compounds that clear this threshold are indicated as green dots. MEK inhibitors are highlighted as gray boxes and pro-myelinating drugs are highlighted as yellow dots. See also Table S5. (B) Pie charts of the number of MEK inhibitors (in dark gray) and other compounds classes (in blue) within top hits compared to their prevalence in the non-toxic compounds of the Selleck library. p-value was calculated using hypergeometric analysis. (C) Representative immunocytochemistry images of oligodendrocytes (MBP+ in green) from the primary drug screen of the top 5 MEK inhibitor hits along with the DMSO negative control. Nuclei are marked by DAPI (in blue). Scale bars, 100μm.
(D) Heatmap showing the row normalized fold change in the percentage (MBP+ / DAPI) of oligodendrocytes relative to DMSO treated sgVhl OPCs of an 8-point dose curve of the primary hits. The heatmap rows are sorted by unsupervised hierarchical clustering with columns in order from high (10μM) to low dose (78nM). MEK inhibitors are highlighted in gray and bolded. Data are presented as the mean from 3 separate dose curve plates. See also Table S6.
(E) Averaging all 8 doses shows the ability of each MEK inhibitor to increase the formation of oligodendrocytes (MBP+/DAPI) relative to DMSO treated sgVhl OPCs. Green and blue columns represent the most and least effective compounds respectively. Data are presented as the mean ± SD from 3 separate dose curve plates. p-values were calculated using a one-way ANOVA with Tukey’s multiple comparisons test.
(F) Representative western blot for phosphorylated ERK1/2 (p-ERK1/2) relative to total ERK1/2 of sgVhl OPCs incubated with 100nM of indicated MEK inhibitors for 30 minutes.
(G) Quantification of the ratio of p-ERK1/2 to total ERK1/2 for the most (in green) and least (in blue) effective MEK inhibitors relative to DMSO treated controls. Data are presented as mean ± SD from 3 biological replicates. p-values were calculated using one-way ANOVA with Dunnett’s multiple comparisons test.
See also Figure S5.