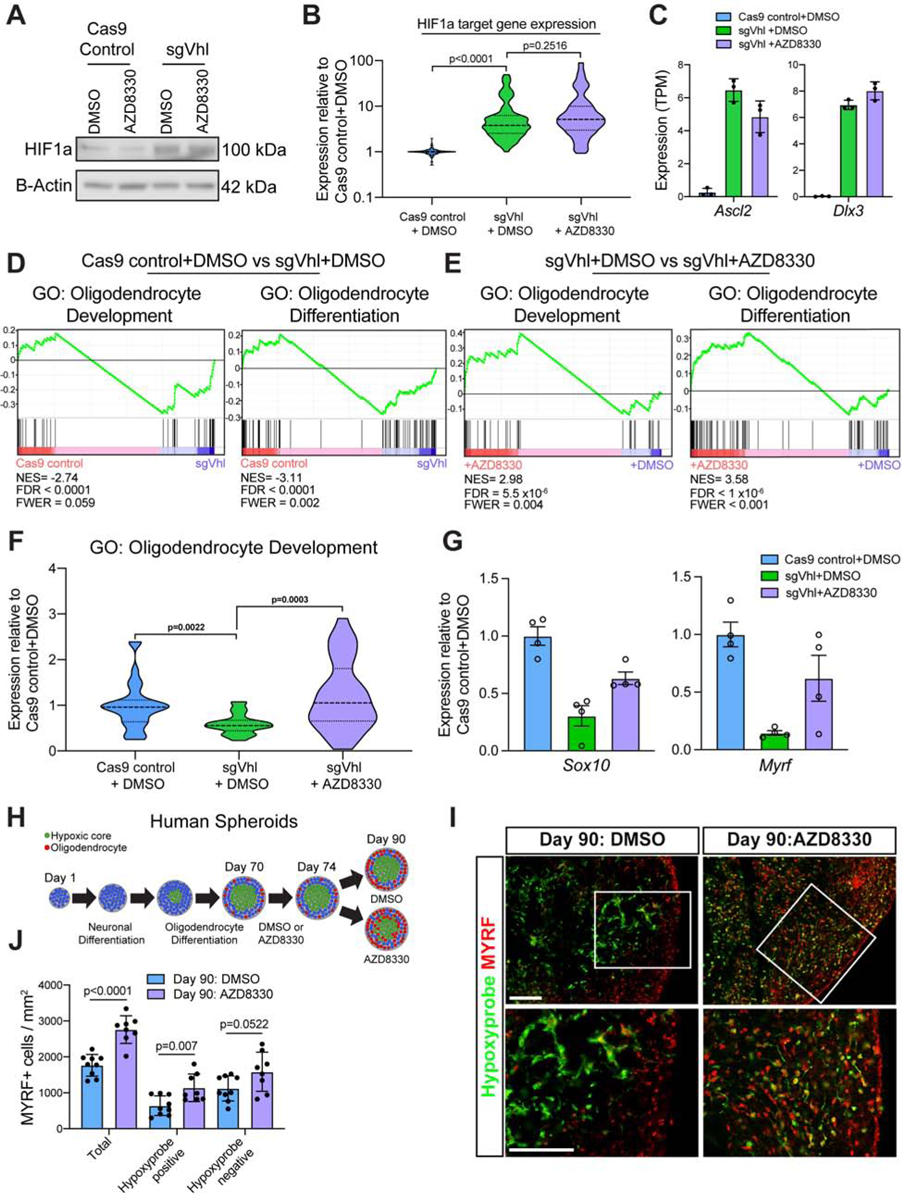
Figure 6. MEK Inhibitors Restore Sox10 Expression Independent of HIF1a Activity in OPCs.

(A) Western blot for HIF1a in sgVhl OPCs treated with AZD8330 or DMSO. Data represent results from a single biological replicate.
(B) Violin plot of normalized expression (TPM values normalized to Cas9 control+DMSO) of direct functional targets of HIF1a (see Figure 2B) in Cas9 control+DMSO (in blue), sgVhl + DMSO (in green), and sgVhl + AZD8330 (in purple) OPCs.
(C) Quantification of normalized expression (TPM) for both Ascl2 and Dlx3 in Cas9 control+DMSO (in blue), sgVhl+DMSO (in green) and sgVhl+AZD8330 (in purple) OPCs. Data represent mean ± SD from 3 independent RNA-seq replicates.
(D) Gene set enrichment analysis (GSEA) analysis of gene program changes in sgVhl compared to Cas9 control OPCs demonstrates a significant reduction (FDR<0.001) in GO terms for Oligodendrocyte Development (normalized enrichment score/NES = −2.74) and Oligodendrocyte Differentiation (NES = −3.11).
(E) GSEA analysis of gene program changes in sgVhl + AZD8330 compared to sgVhl + DMSO OPCs demonstrates a significant enrichment (FDR<0.001) in GO terms for Oligodendrocyte Development (normalized enrichment score/NES = 2.98) and Oligodendrocyte Differentiation (NES = 3.58).
(F) Violin plot showing normalized expression (TPM values normalized to Cas9 control + DMSO OPCs) of genes in the GO term Oligodendrocyte Development (GO:0014003) that decrease (FC<0.75) in sgVhl + DMSO OPCs (in green) relative to Cas9 control + DMSO OPCs (in blue) as well as sgVhl OPCs following treatment with AZD8330.
(G) qRT-PCR of Sox10 and Myrf in Cas9 control+DMSO (in blue), sgVhl+DMSO (in green) and sgVhl+AZD8330 (in purple) OPCs. Data are presented as mean ± SEM from 4 technical replicates (individual wells).
(H) Schematic of human brain oligocortical spheroids treated at days in vitro (DIV) 70 with either DMSO or AZD8330 for 4 days. At day 90, organoids were incubated with hypoxyprobe, fixed, and sectioned for immunohistochemistry.
(I) Representative immunohistochemistry images for oligodendrocytes (MYRF+ in red) and hypoxic regions (hypoxyprobe in green) of DIV 90 oligocortical spheroids at low and high magnification that were treated from DIV 70–74 with DMSO or AZD8330. Scale bars, 100μM.
(J) Quantification of oligodendrocytes (MYRF+ / mm2) in the whole oligocortical spheroid (total), hypoxic region of the spheroid (hypoxyprobe positive), and normoxic region of the spheroid (hypoxyprobe negative) in DIV 90 spheroids that had been treated with DMSO or AZD8330 from DIV 70–74. Data represent mean ± SD from 8–9 individual spheroids. p-values were calculated using Student’s two-tailed t-test.
AZD8330 was used at a dose of 300nM for all experiments and p-values for violin plots were calculated using the Kruskal Wallis One-Way ANOVA with Dunn’s multiple comparisons test.
See also Figure S6.
