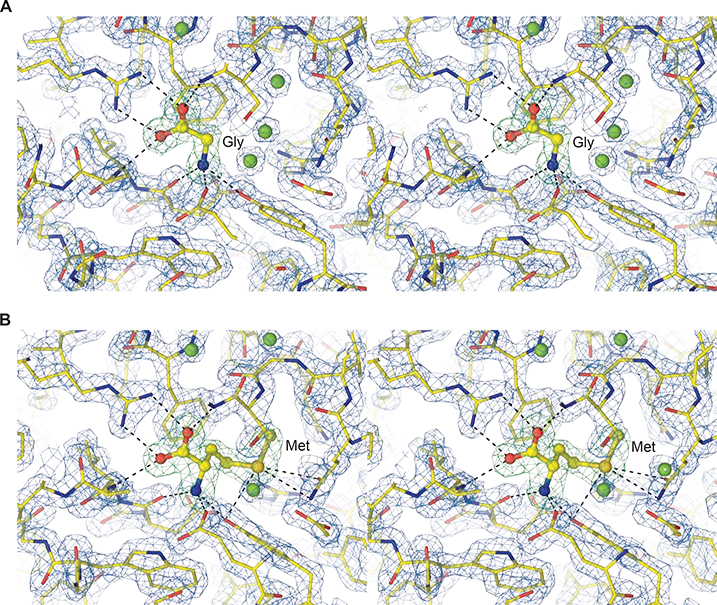
Figure 1. AtGLR3.2-LBD electron density.
A-B, Close-up stereo view of AtGLR3.2 LBD (S1S2) in complex with (A) glycine and (B) methionine. Mesh shows a 2Fo-Fc electron density map contoured at 2 σ (blue) and Fo-Fc map contoured at 4 σ (green) when ligands were not present in the model.
See also Figure S2.

