Figure 6.

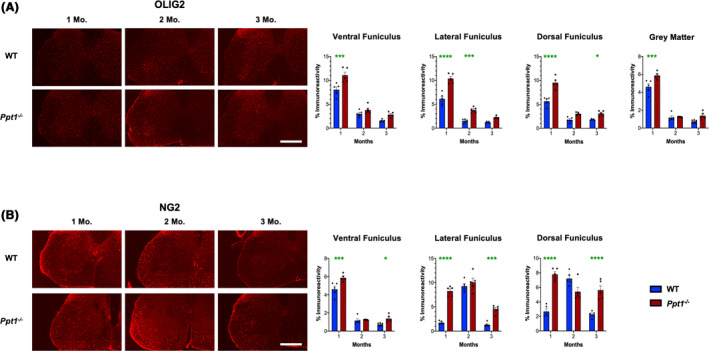
Dysregulated oligodendrocyte maturation in Ppt1−/− mouse spinal cords. (A) Representative images and thresholding image analysis data for lumbosacral spinal cord sections immunostained for the oligodendrocyte precursor marker Olig2 reveal significant increase in immunoreactivity for this marker in the ventral, lateral and dorsa funiculi of the spinal white matter, as well as the total grey matter area at 1 month (Mo.), as well as significant increases in the lateral funiculus at 2 months, and dorsal funiculus at 3 months in Ppt1−/− mice as compared to WT mice. (B) Representative images and thresholding image analysis data for lumbosacral spinal cord sections stained for the oligodendrocyte precursor marker NG2 chondroitin sulphate proteoglycan (NG2) reveal significant increases in NG2 immunoreactivity in the ventral, lateral and dorsal funiculi of the white matter at 1 month and 3 months in Ppt1−/− mice as compared to WT mice. P‐values ‐ *p ≤ 0.05, ***p ≤ 0.001, ****p ≤ 0.0001; two‐way ANOVA with post hoc Bonferroni correction. Values shown are mean ± SEM. (n = 5 mice/group).
