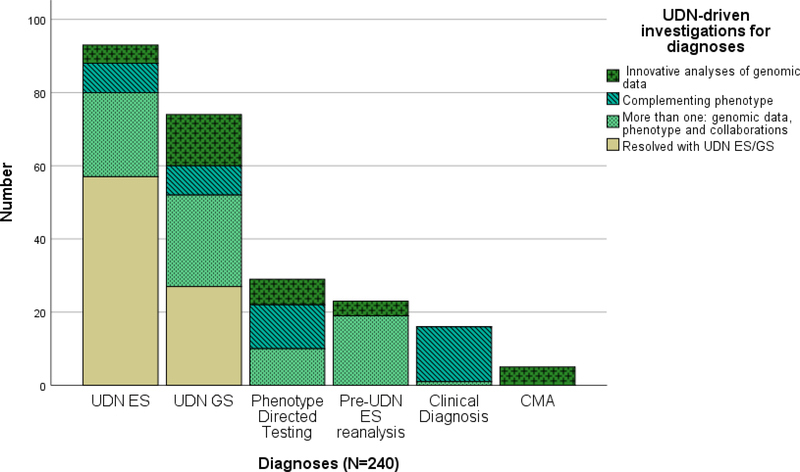
Figure 1. Details of the 240 diagnoses.
The beige portions of the bars indicate diagnoses that were made in a straightforward manner from ES/GS that was performed by the UDN sequencing core with integration of the phenotype by the UDN clinical sites. The 57 diagnoses (24%) that were due to UDN ES and 27 diagnoses (11%) that were due to UDN GS are similar to what could be accomplished in a regular genetics clinic. The green portions indicate diagnoses that were made with additional UDN-driven investigations that are difficult to accomplish in regular clinical settings.. In aggregate the majority of diagnoses (n= 156 of 240, 65%) occurred due to the additional and most often multiple UDN-driven investigations, initiated at the clinical sites.

