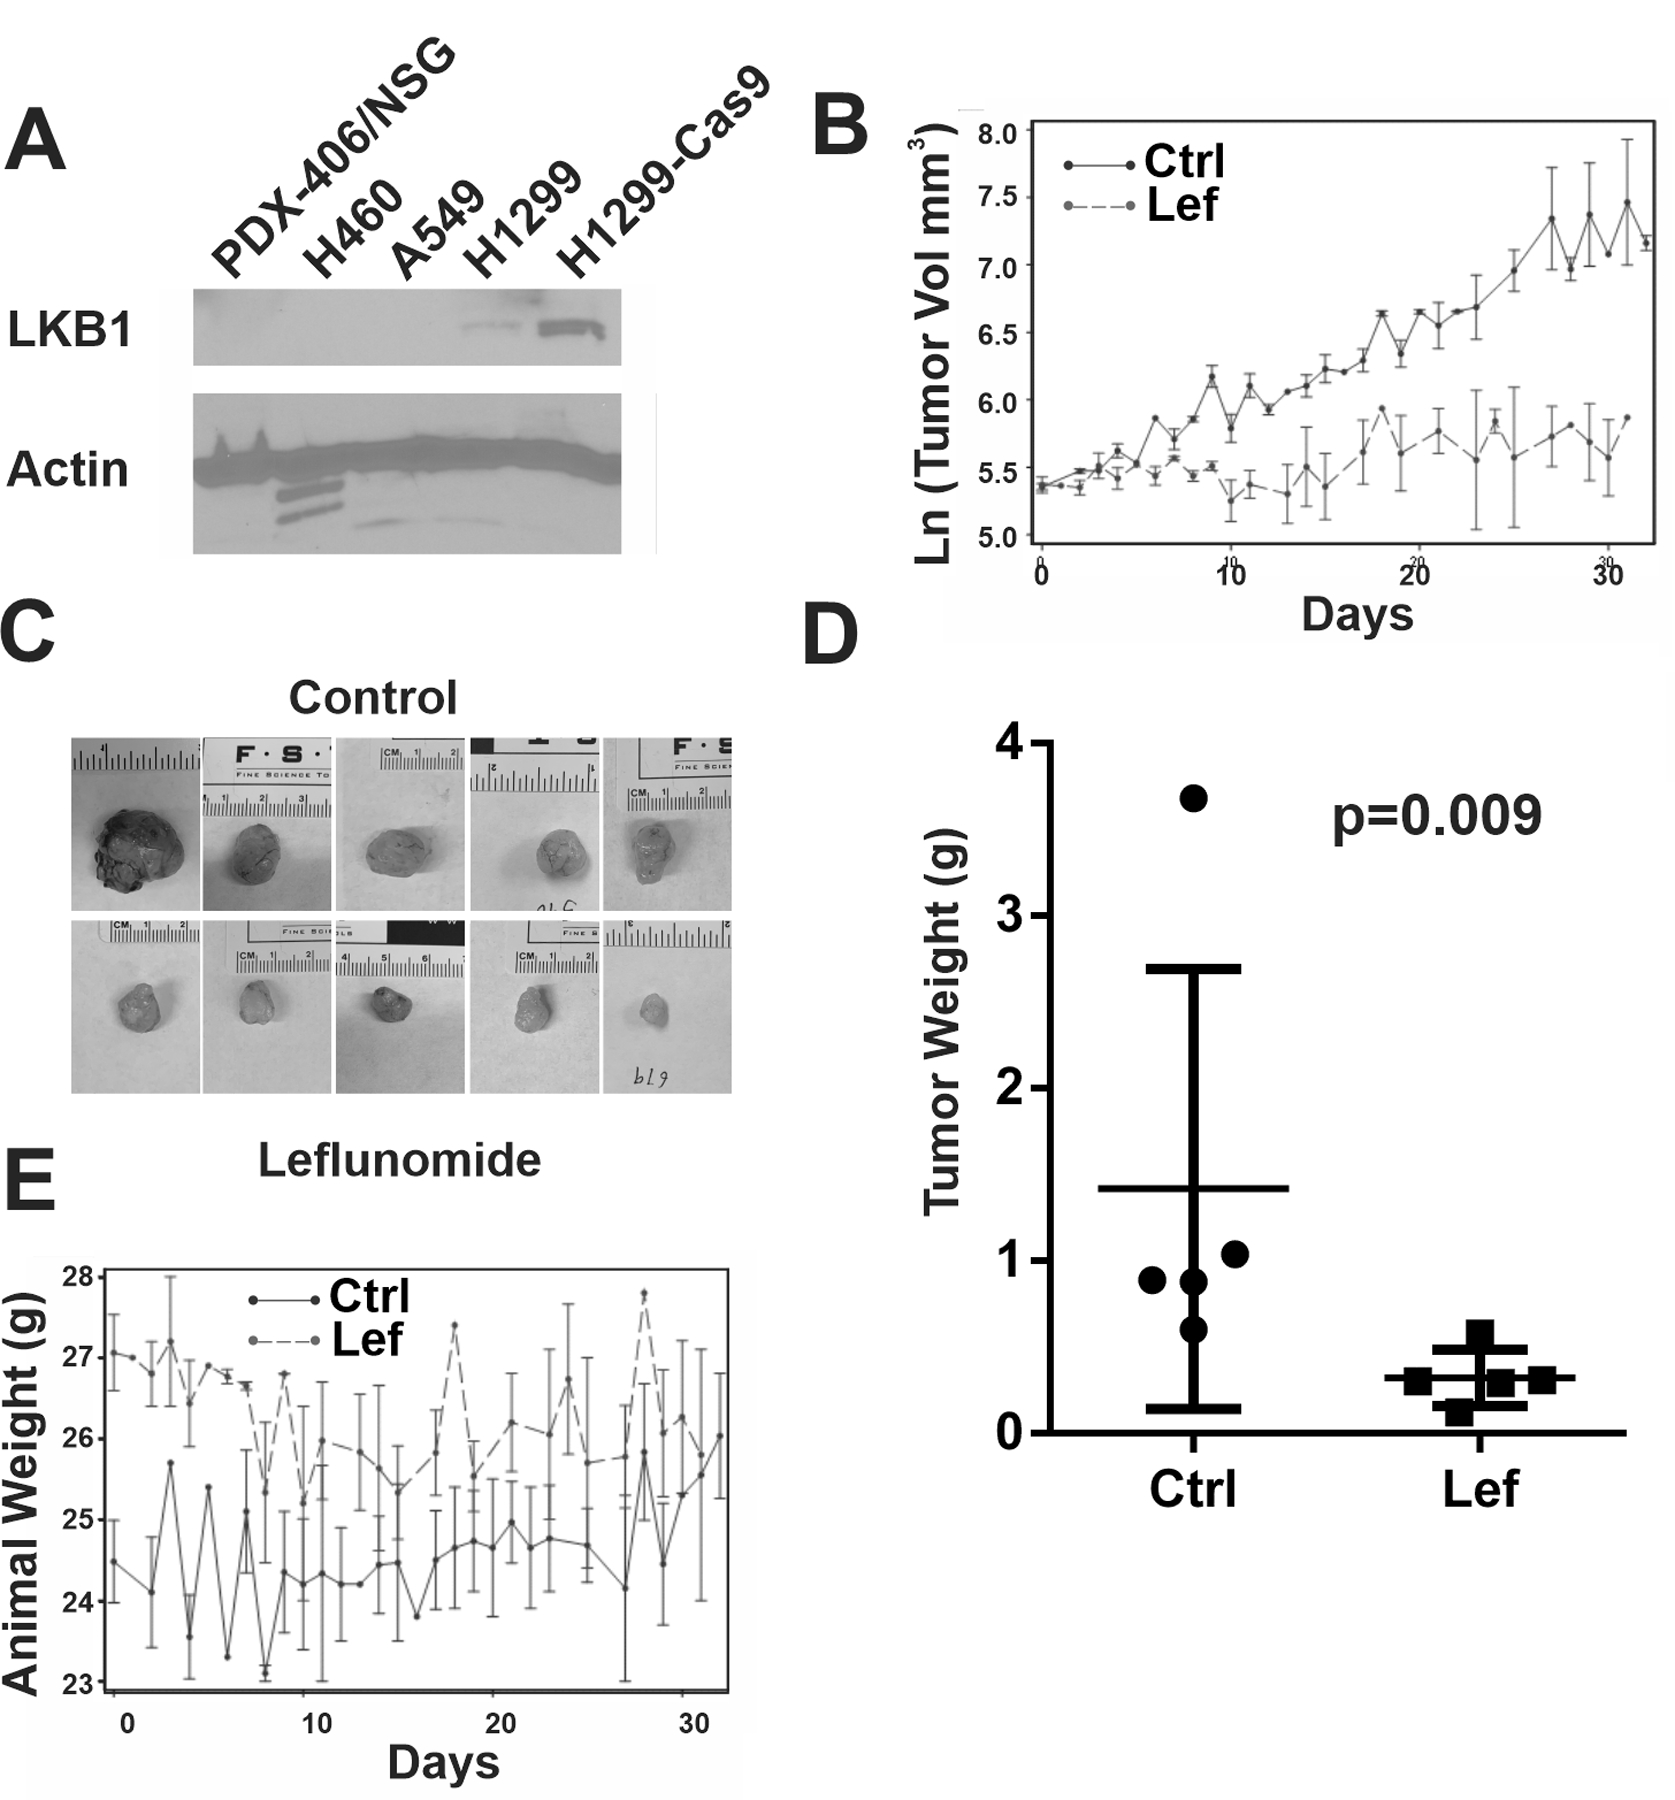
Figure 3. Leflunomide treatment of LKB1-null patient-derived xenograft.

(A) Immunoblot analysis of LKB1 protein expression in indicated PDX or cell lines using actin as a loading control. (B) Estimated PDX growth over the 31-day treatment period (X-axis). Y-axis represents Ln(Tumor Volume in mm3). (C) Photos of isolated PDX at the end of the study. (D). Tumor Weight (g) comparison in the control and treated group with indicated Kruskal-Wallis p-value. (E). Animal weight (g) over the 31-day treatment period (X-axis).
