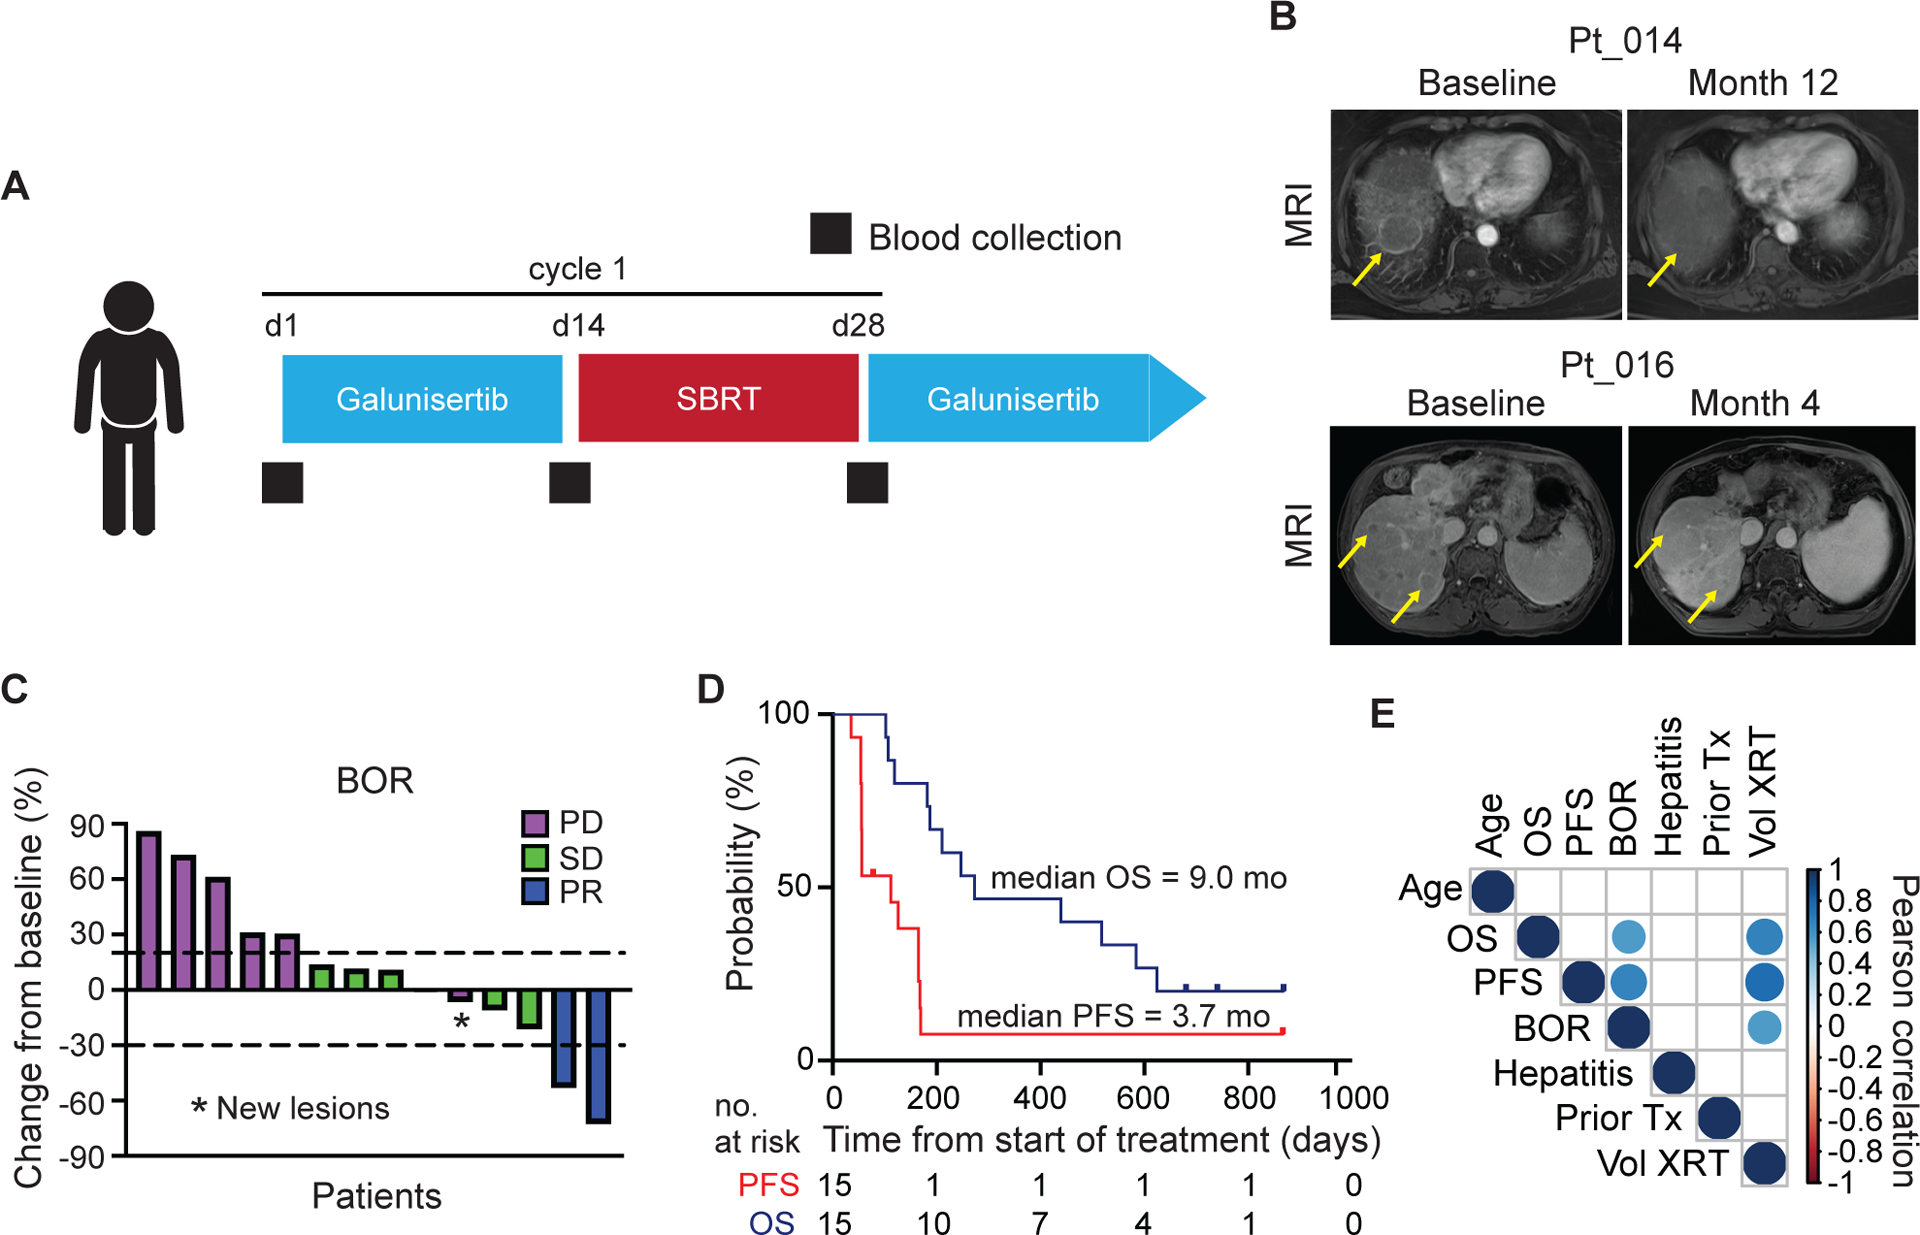
Figure 1. Trial design and clinical outcomes.

(A) Study schema. Patients received galunisertib 150 mg PO twice daily for days 1–14 of each 28-day cycle. Radiation (SBRT 18-Gy in one fraction) was delivered during cycle one only between days 15–28. Blood for isolation of PBMCs was collected at baseline, prior to SBRT and prior to start of cycle 2 (black squares). (B) Sequential contrast enhanced MRI for patients 014 and 016. Yellow arrows mark representative non-irradiated lesions. (C) Best overall response showing percent change in target lesions from baseline measured by RECIST 1.1. One patient withdrew consent and was not evaluable for radiologic response. One patient had non-target lesion progression (*). (D) Kaplan Meier plots showing progression free survival and overall survival. (E) Correlation matrix of clinical variables. Colored circles represent Pearson’s correlations with a significance of p < 0.05. BOR, best overall response; OS, overall survival; PFS, progression free survival.
