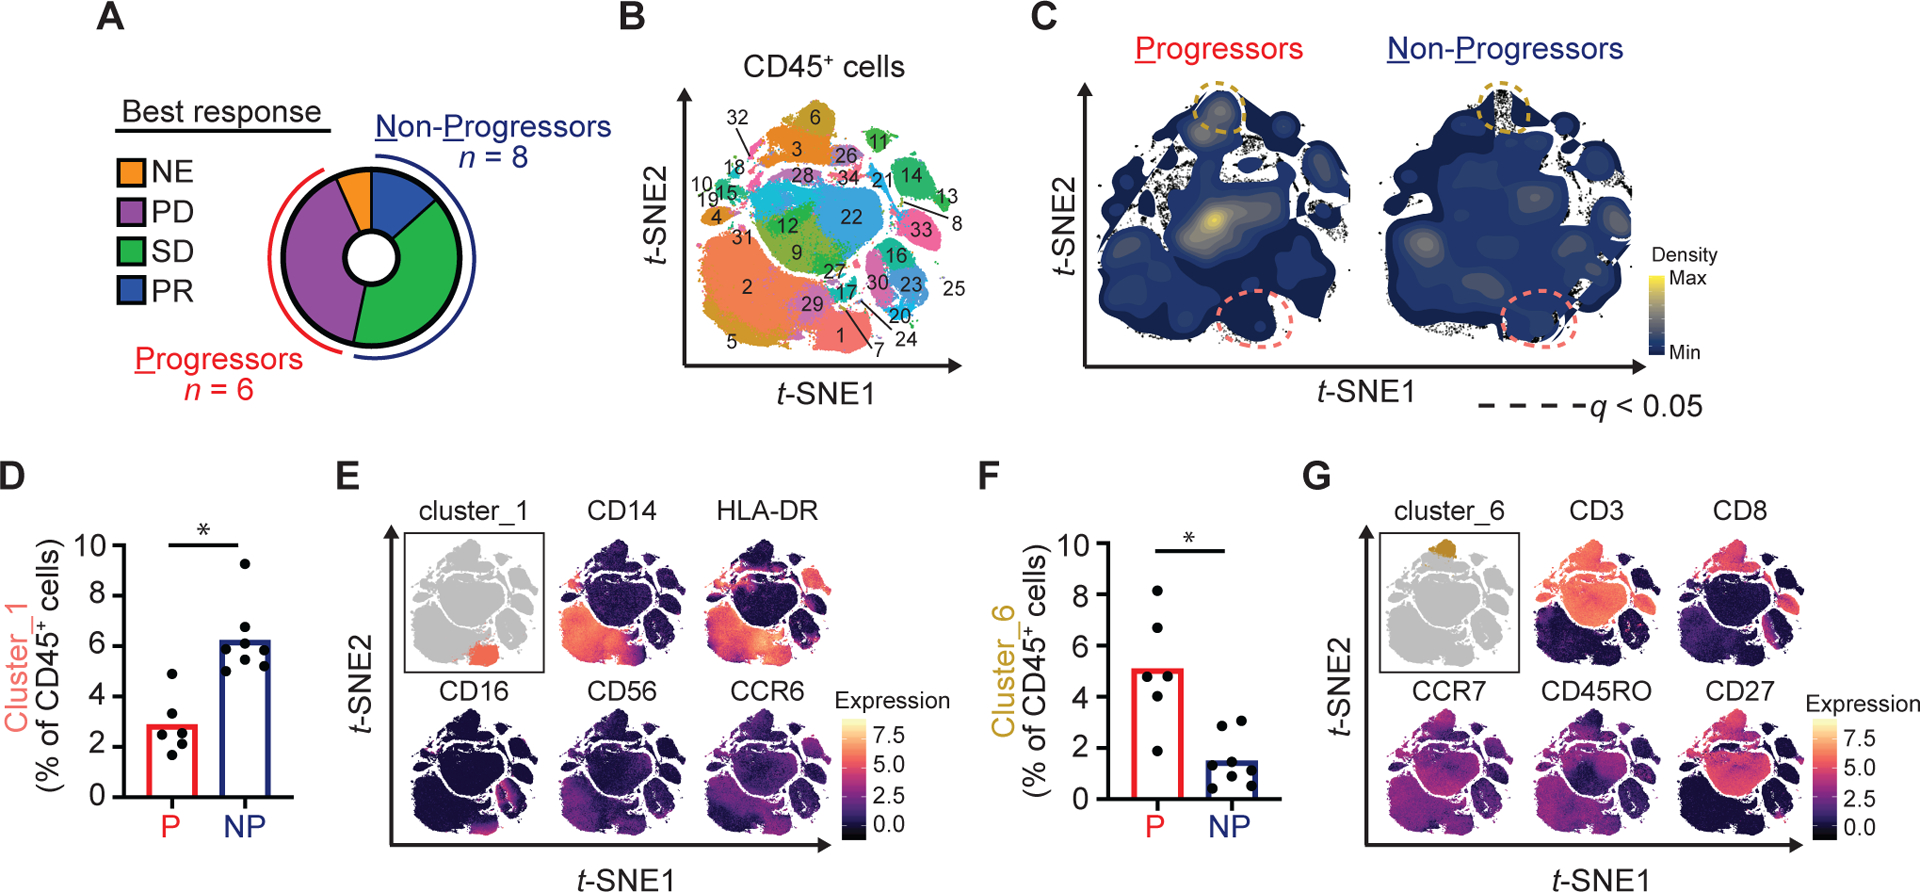
Figure 2. Pre-treatment immune subsets in the peripheral blood associate with outcomes to galunisertib and radiation.

(A) Donut chart showing classification of patients as Progressors (P) or Non-Progressors (NP) based on best overall response measured with RECIST 1.1. One patient was not evaluable for radiologic response. (B) PBMC collected at baseline were analyzed by high-dimensional single cell mass cytometry. Shown is phenograph clustering analysis performed after exclusion of doublets and dead cells and positive selection for CD45. (C) Density plots showing clusters significantly altered between Progressors as compared to Non-Progressors. (D) Quantification of cluster_1 (percentage of CD45+ cells). (E) Marker expression level plots. (F) Quantification of cluster_6 (percentage of CD45+ cells). (G) Marker expression level plots. Multiple t-tests were performed with Benjamini, Krieger and Yekutieli correction. *, q < 0.05. NE, not evaluable; PD, progressive disease; SD, stable disease; PR, partial response.
